24 Mar , 2026 By : Debdeep Gupta

The Nifty 50 started the week with a 2.6 percent loss on March 23, tracking a correction in global peers amid the escalation of the Iran war. However, comments by US President Donald Trump after-market hours about productive talks between the US and Iran for a total resolution of hostilities in the Middle East have raised hopes of de-escalation. Momentum indicators also appear oversold after the sharp correction in the recent past. Hence, experts expect the Nifty 50 to rebound in the upcoming session, with an immediate hurdle at 23,000, followed by 23,200. However, the sustainability of any such rally will be key to watch, given the overall bearish setup. Immediate support is placed in the 22,500–22,400 zone.
Here are 15 data points we have collated to help you spot profitable trades:
1) Key Levels For The Nifty 50 (22,513)
Resistance based on pivot points: 22,757, 22,847, and 22,992
Support based on pivot points: 22,467, 22,377, and 22,231
Special Formation: The Nifty 50 formed a large bearish candle on the daily charts after a gap-down opening, signalling that bears have a strong hold on the market. All key moving averages are trending downward, with a continuation of the lower high–lower low formation. Momentum indicators are in the oversold zone, with the RSI falling to 27.17, indicating a potential bullish divergence near critical support and suggesting a possible short-term recovery. The MACD remained near Covid lows, with a dark red bar in the histogram, showing signs of losing downside momentum. All this indicates a possibility of a near-term pullback, though the broader trend remains weak.
2) Key Levels For The Bank Nifty (51,438)
Resistance based on pivot points: 52,321, 52,638, and 53,151
Support based on pivot points: 51,296, 50,980, and 50,467
Resistance based on Fibonacci retracement: 53,788, 55,316
Support based on Fibonacci retracement: 50,705, 47,695
Special Formation: The Bank Nifty tanked 3.72 percent and underperformed the benchmark Nifty 50, forming a long bearish candle on the daily timeframe after a steep gap-down opening, signalling a strong bearish trend. The index traded well below all key moving averages. The MACD is extremely oversold and showing signs of losing downside momentum, while the RSI has signalled a bullish divergence, indicating stability near critical support and hinting at a possible short-term recovery. All this indicates a potential rebound, although the overall structure remains under pressure.
3) Nifty Call Options Data
According to the weekly options data, the maximum Call open interest was seen at the 23,000 strike (with 71.89 lakh contracts). This level can act as a key resistance level for the Nifty in the short term. It was followed by the 23,300 strike (59.15 lakh contracts) and 23,200 strike (48.42 lakh contracts).
Maximum Call writing was observed at the 23,000 strike, which saw an addition of 44.81 lakh contracts, followed by the 22,700 and 22,500 strikes, which added 39.15 lakh and 34.01 lakh contracts, respectively. There was hardly any Call unwinding seen in the 21,700-23,300 strike band.
4) Nifty Put Options Data
On the Put side, the 22,000 strike holds the maximum Put open interest (with 79.06 lakh contracts), which can act as a key support level for the Nifty in the short term. It was followed by the 22,500 strike (55.16 lakh contracts) and the 21,700 strike (37.57 lakh contracts).
The maximum Put writing was placed at the 21,700 strike, which saw an addition of 19.66 lakh contracts, followed by the 22,300 and 21,800 strikes, which added 14.76 lakh and 12.4 lakh contracts, respectively. The maximum Put unwinding was seen at the 23,000 strike, which shed 39.7 lakh contracts, followed by the 23,100 and 22,800 strikes, which shed 24.34 lakh and 21.8 lakh contracts, respectively.
5) Bank Nifty Call Options Data
According to the monthly options data, the maximum Call open interest was seen at the 53,000 strike, with 3.86 lakh contracts. This can act as a key resistance level for the index in the short term. It was followed by the 52,000 strike (3.57 lakh contracts) and the 52,500 strike (2.15 lakh contracts).
Maximum Call writing was observed at the 52,000 strike (with the addition of 2.84 lakh contracts), followed by the 53,000 strike (2.5 lakh contracts) and 52,500 strike (1.96 lakh contracts). There was hardly any Call unwinding seen in the 49,750-53,000 strike band.
6) Bank Nifty Put Options Data
On the Put side, the 51,000 strike holds the maximum Put open interest (with 6.32 lakh contracts), which can act as a key support level for the index. This was followed by the 50,000 strike (5.3 lakh contracts) and the 51,500 strike (5.17 lakh contracts).
The maximum Put writing was placed at the 50,500 strike (which added 2.09 lakh contracts), followed by the 51,800 (51,510 contracts) and 50,900 (48,330 contracts). The maximum Put unwinding was seen at the 53,000 strike, which shed 2.08 lakh contracts, followed by the 52,000 and 52,500 strikes, which shed 1.52 lakh and 1.39 lakh contracts, respectively.
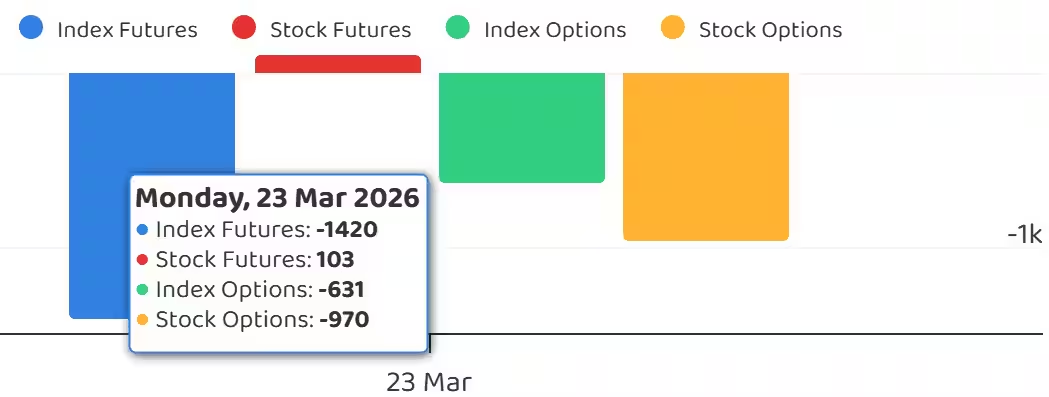
7) Funds Flow (Rs crore)
8) Put-Call Ratio
The Nifty Put-Call ratio (PCR), which indicates the mood of the market, falls to 0.84 on March 23, compared to a 0.93 in previous session.
The increasing PCR, or being higher than 0.7 or surpassing 1, means traders are selling more Put options than Call options, which generally indicates the firming up of a bullish sentiment in the market. If the ratio falls below 0.7 or moves towards 0.5, then it indicates selling in Calls is higher than selling in Puts, reflecting a bearish mood in the market.
9) India VIX
The India VIX, also known as the fear index, spiked 17.17 percent to 26.73, the highest level since early June 2024, signalling major discomfort for bulls. A decisive fall below 20 could provide some relief to the bulls.
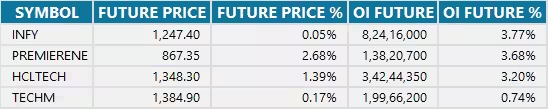
10) Long Build-up (4 Stocks)
A long build-up was seen in 4 stocks. An increase in open interest (OI) and price indicates a build-up of long positions.
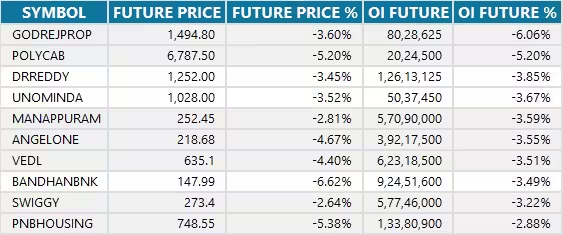
11) Long Unwinding (91 Stocks)
91 stocks saw a decline in open interest (OI) along with a fall in price, indicating long unwinding.
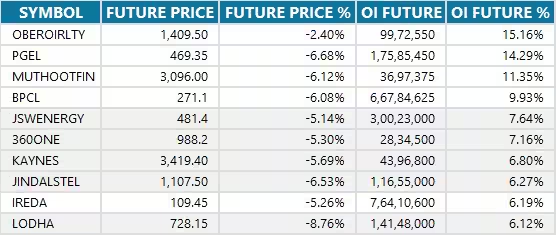
12) Short Build-up (112 Stocks)
112 stocks saw an increase in OI along with a fall in price, indicating a build-up of short positions.
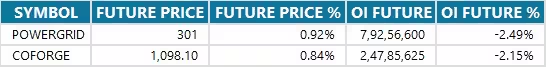
13) Short-Covering (2 Stocks)
2 stocks saw short-covering, meaning a decrease in OI, along with a price increase.
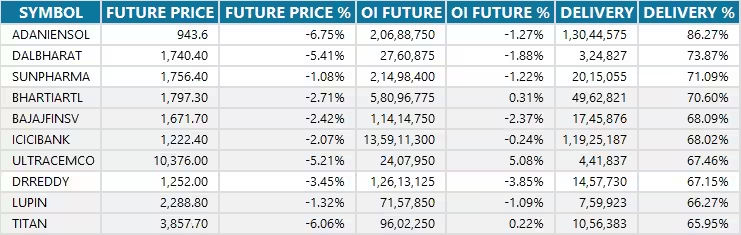
14) High Delivery Trades
Here are the stocks that saw a high share of delivery trades. A high share of delivery reflects investing (as opposed to trading) interest in a stock.
15) Stocks Under F&O Ban
Securities banned under the F&O segment include companies where derivative contracts cross 95 percent of the market-wide position limit.
Stocks added to F&O ban: Nil
Stocks retained in F&O ban: SAIL, Sammaan Capital
Stocks removed from F&O ban: Nil


0 Comment