16 Mar , 2026 By : Debdeep Gupta

The Nifty 50 succumbed to further selling pressure, falling more than 2 percent to end at a fresh 11-month closing low on March 13. Middle East tensions are expected to persist in the near term, keeping oil prices elevated, as US defence forces targeted military sites near Kharg Island, an important terminal for Iranian oil exports. The move signals a warning from Donald Trump that Iranian oil facilities could be targeted if Tehran continues to disrupt shipping through the Strait of Hormuz. Momentum and technical indicators maintained a bearish bias, though they appeared oversold, with an elevated VIX. According to experts, if the Nifty fails to take support at the psychological level of 23,000, a fall toward 22,700 cannot be ruled out in the upcoming sessions. However, 23,300–23,500 can act as immediate resistance.
Here are 15 data points we have collated to help you spot profitable trades:
1) Key Levels For The Nifty 50 (23,151)
Resistance based on pivot points: 23,397, 23,487, and 23,632
Support based on pivot points: 23,107, 23,017, and 22,871
Special Formation: The Nifty 50 formed a long bearish candle on the daily timeframe, continuing the lower high–lower low structure with above-average volumes, signalling that bears have strong control over the market. The index broke the 61.8 percent Fibonacci retracement (of the rally from the April 2025 low to the January 2026 high). The RSI fell below the 25 zone to 24.15, while the Stochastic RSI remained in the oversold zone. The MACD dropped to near Covid-era lows with further red bar expansion in the histogram. All this indicates strong bearish momentum.
2) Key Levels For The Bank Nifty (53,758)
Resistance based on pivot points: 54,446, 54,691, and 55,087
Support based on pivot points: 53,653, 53,408, and 53,011
Resistance based on Fibonacci retracement: 55,618, 56,797
Support based on Fibonacci retracement: 53,077, 50,712
Special Formation: The Bank Nifty reported a long red candle on the daily charts and fell decisively below the 50 percent Fibonacci retracement (of the rally from the March 2025 low to the February 2026 high), indicating a strong bearish bias. The index sustained below all key moving averages, with the 20-, 50-, and 100-day EMAs trending downward. The RSI declined to 23, while the MACD fell to its lowest level since March 2020, with further red bar expansion in the histogram. All this indicates strong bearish momentum in the banking index.
3) Nifty Call Options Data
According to the weekly options data, the maximum Call open interest was seen at the 23,500 strike (with 48.52 lakh contracts). This level can act as a key resistance level for the Nifty in the short term. It was followed by the 23,600 strike (47.8 lakh contracts) and 23,700 strike (46.8 lakh contracts).
Maximum Call writing was observed at the 23,500 strike, which saw an addition of 40.29 lakh contracts, followed by the 23,600 and 23,200 strikes, which added 29.4 lakh and 25.71 lakh contracts, respectively. There was hardly any Call unwinding seen in the 22,500-23,900 strike band.
4) Nifty Put Options Data
On the Put side, the 23,000 strike holds the maximum Put open interest (with 64.28 lakh contracts), which can act as a key support level for the Nifty in the short term. It was followed by the 22,500 strike (58.37 lakh contracts) and the 22,800 strike (47.1 lakh contracts).
The maximum Put writing was placed at the 22,800 strike, which saw an addition of 18.86 lakh contracts, followed by the 22,500 and 22,600 strikes, which added 15.06 lakh and 14.25 lakh contracts, respectively. The maximum Put unwinding was seen at the 23,600 strike, which shed 27.63 lakh contracts, followed by the 23,500 and 23,700 strikes, which shed 25.34 lakh and 16.74 lakh contracts, respectively.
5) Bank Nifty Call Options Data
According to the monthly options data, the maximum Call open interest was seen at the 55,000 strike, with 6.58 lakh contracts. This can act as a key resistance level for the index in the short term. It was followed by the 54,000 strike (2.68 lakh contracts) and the 54,500 strike (2.52 lakh contracts).
Maximum Call writing was observed at the 55,000 strike (with the addition of 2.55 lakh contracts), followed by the 54,500 strike (2.25 lakh contracts) and 54,000 strike (2.07 lakh contracts). There was hardly any Call unwinding seen in the 52,500-55,250 strike band.
6) Bank Nifty Put Options Data
On the Put side, the 54,000 strike holds the maximum Put open interest (with 6.49 lakh contracts), which can act as a key level for the index. This was followed by the 53,000 strike (5.75 lakh contracts) and the 55,000 strike (5.71 lakh contracts).
The maximum Put writing was placed at the 52,500 strike (which added 1.79 lakh contracts), followed by the 53,200 (93,390 contracts) and 52,700 (62,370 contracts). The maximum Put unwinding was seen at the 55,000 strike, which shed 87,390 contracts, followed by the 55,200 and 55,100 strikes, which shed 44,280 and 21,720 contracts, respectively.
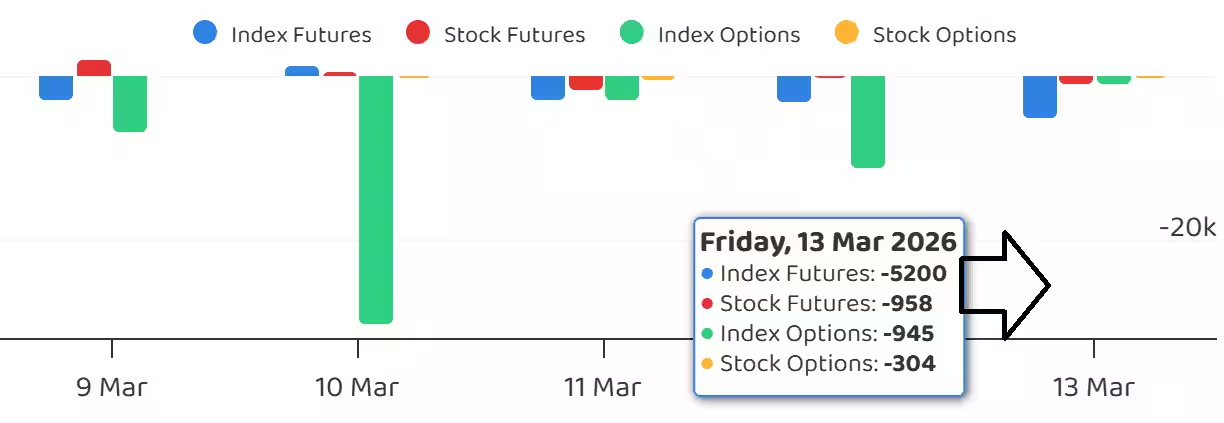
7) Funds Flow (Rs crore)
8) Put-Call Ratio
The Nifty Put-Call ratio (PCR), which indicates the mood of the market, dropped to 0.75 on March 13, compared to a 0.86 in previous session.
The increasing PCR, or being higher than 0.7 or surpassing 1, means traders are selling more Put options than Call options, which generally indicates the firming up of a bullish sentiment in the market. If the ratio falls below 0.7 or moves towards 0.5, then it indicates selling in Calls is higher than selling in Puts, reflecting a bearish mood in the market.
9) India VIX
The fear gauge, India VIX, jumped 5.24 percent to 22.64, extending its uptrend for the third consecutive session, with all key moving averages trending upward, signalling major risk for bulls.
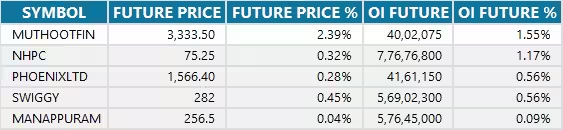
10) Long Build-up (5 Stocks)
A long build-up was seen in 5 stocks. An increase in open interest (OI) and price indicates a build-up of long positions.
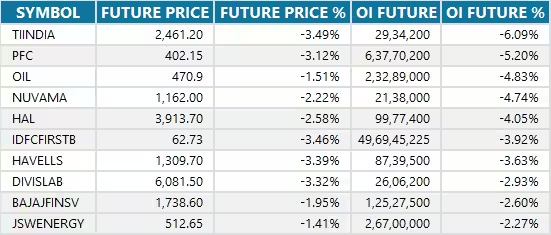
11) Long Unwinding (76 Stocks)
76 stocks saw a decline in open interest (OI) along with a fall in price, indicating long unwinding.
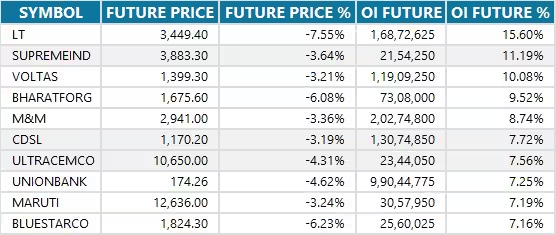
12) Short Build-up (123 Stocks)
123 stocks saw an increase in OI along with a fall in price, indicating a build-up of short positions.
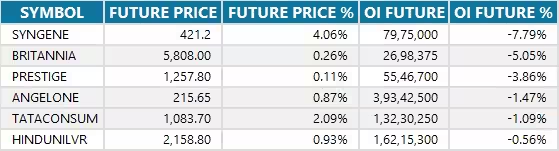
13) Short-Covering (6 Stocks)
6 stocks saw short-covering, meaning a decrease in OI, along with a price increase.
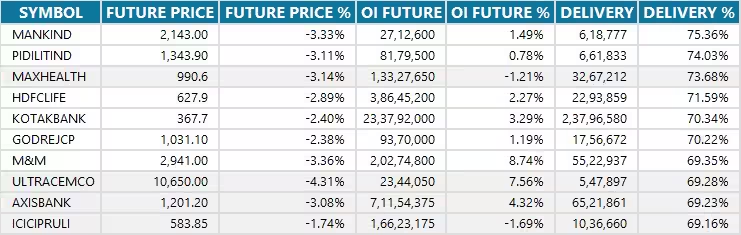
14) High Delivery Trades
Here are the stocks that saw a high share of delivery trades. A high share of delivery reflects investing (as opposed to trading) interest in a stock.
15) Stocks Under F&O Ban
Securities banned under the F&O segment include companies where derivative contracts cross 95 percent of the market-wide position limit.
Stocks added to F&O ban: Nil
Stocks retained in F&O ban: SAIL, Sammaan Capital
Stocks removed from F&O ban: Nil


0 Comment