15 Oct , 2024 By : Debdeep Gupta

Nifty Trade Setup
The market gained strength after a three-day consolidation, climbing seven-tenths of a percent on October 14 with a further decline in volatility. The Nifty 50 formed a bullish candlestick pattern on the daily charts and managed to close above the 50-day EMA (Exponential Moving Average) at 25,050. As long as it sustains above this level, an upward rally towards the 25,200-25,300 range can't be ruled out, followed by the 25,500-25,600 zone, while crucial support lies at 24,800, according to experts.
Here are 15 data points we have collated to help you spot profitable trades:
1) Key Levels For The Nifty 50 (25,127.9)
Resistance based on pivot points: 25,156, 25,190, and 25,244
Support based on pivot points: 25,047, 25,014, and 24,959
Special Formation: The Nifty 50 recorded a higher high-higher low formation and closed above the previous week's high. The index climbed above the 50-day EMA but still traded below the 10-day and 20-day EMAs. The momentum indicator RSI (Relative Strength Index) at 46.54 on the daily charts seems to be climbing towards the 50 mark.
2) Key Levels For The Bank Nifty
Resistance based on pivot points: 51,900, 52,059, and 52,316
Support based on pivot points: 51,387, 51,228, and 50,972
Resistance based on Fibonacci retracement: 52,323, 52,827
Support based on Fibonacci retracement: 51,271, 50,282
Special Formation: The Bank Nifty formed a long bullish candlestick pattern on the daily timeframe and closed above the 10-day and 50-day EMAs, but still below the 20-day EMA and the 50 percent Fibonacci retracement level (52,323), taken from the record high to October low. The momentum indicator RSI (48.64) is also inching towards the 50 mark. The index closed at 51,817, up 645 points or 1.26 percent.
3) Nifty Call Options Data
According to the weekly options data, the 26,000 strike holds the maximum open interest (with 65.23 lakh contracts). This level can act as a key resistance level for the Nifty in the short term. It was followed by the 25,500 strike (52.67 lakh contracts) and the 25,200 strike (44.88 lakh contracts).
Maximum Call writing was observed at the 25,400 strike, which saw an addition of 10.55 lakh contracts, followed by the 25,600 and 25,500 strikes, which added 8.63 lakh and 7.28 lakh contracts, respectively. The Call unwinding was seen at the 25,000 strike, which shed 22.26 lakh contracts, followed by the 26,000 and 24,900 strikes, which shed 9.78 lakh and 2.92 lakh contracts, respectively.
4) Nifty Put Options Data
On the Put side, the maximum open interest was seen at the 25,000 strike (with 66.26 lakh contracts), which can act as a key support level for the Nifty. It was followed by the 24,000 strike (50.53 lakh contracts), and the 24,500 strike (39.75 lakh contracts).
The maximum Put writing was placed at the 25,100 strike, which saw an addition of 17.05 lakh contracts, followed by the 25,000, and 24,500 strikes, with 16.60 lakh, and 12.01 lakh contracts added, respectively, while the Put unwinding was seen at the 24,100 strike, which shed 3.91 lakh contracts, followed by the 26,000, and 25,900 strikes, which shed 13,775 and 8,025 contracts, respectively.
5) Bank Nifty Call Options Data
According to the weekly options data, the 53,000 strike holds the maximum open interest, with 24.46 lakh contracts. This can act as a key resistance level for the index in the short term. It was followed by the 52,000 strike (22.82 lakh contracts) and the 52,500 strike (21.81 lakh contracts).
Maximum Call writing was visible at the 51,900 strikes (with the addition of 6.5 lakh contracts), followed by the 52,200 strikes (5.96 lakh contracts) and the 52,300 strikes (4.35 lakh contracts), while the maximum Call unwinding was seen at the 51,500 strikes, which shed 12.16 lakh contracts, followed by 51,200 and 51,600 strikes, which shed 8.16 lakh and 6.78 lakh contracts, respectively.
6) Short-Covering (61 Stocks)
On the Put side, the maximum open interest was seen at the 51,000 strikes (with 27.57 lakh contracts), which can act as a key support level for the index. This was followed by the 51,500 strike (22.77 lakh contracts) and the 51,300 strike (14.99 lakh contracts).
The maximum Put writing was observed at the 51,500 strike (which added 15.02 lakh contracts), followed by the 51,700 strike (10.98 lakh contracts) and the 51,000 strike (10.97 lakh contracts), while there was hardly any Put unwinding seen.
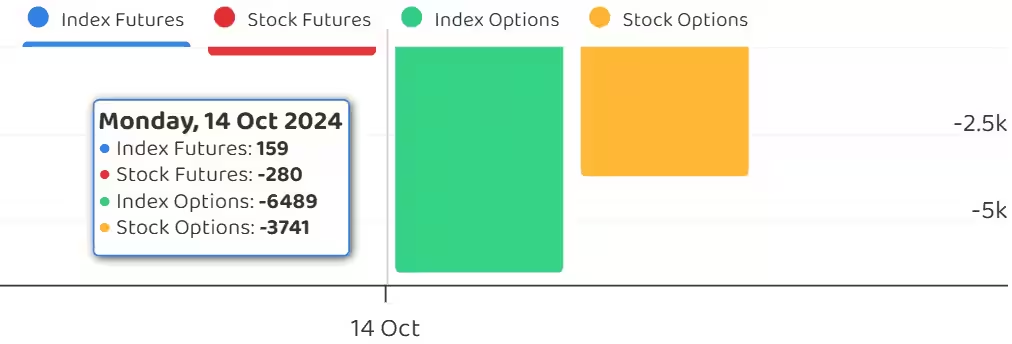
7) Funds Flow (Rs crore)
8) Put-Call Ratio
The Nifty Put-Call ratio (PCR), which indicates the mood of the market, rose to 0.9 on October 14, from 0.84 levels in the previous session.
The increasing PCR, or being higher than 0.7 or surpassing 1, means traders are selling more Put options than Call options, which generally indicates the firming up of a bullish sentiment in the market. If the ratio falls below 0.7 or moves towards 0.5, then it indicates selling in Calls is higher than selling in Puts, reflecting a bearish mood in the market.
9) India VIX
Volatility dropped further and remained below all key moving averages, making the trend more favorable for bulls to drive the market higher. The India VIX, the fear indicator, fell by 1.7 percent to the 13 level, down from 13.22.
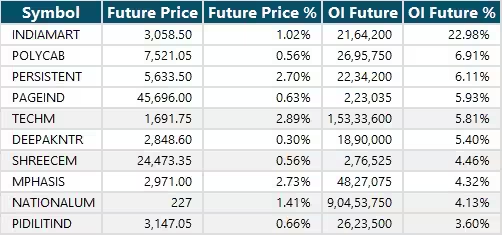
10) Long Build-up (61 Stocks)
A long build-up was seen in 61 stocks. An increase in open interest (OI) and price indicates a build-up of long positions.
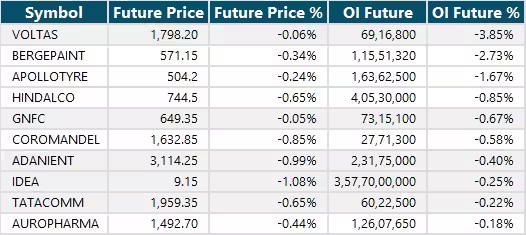
11) Long Unwinding (12 Stocks)
12 stocks saw a decline in open interest (OI) along with a fall in price, indicating long unwinding.
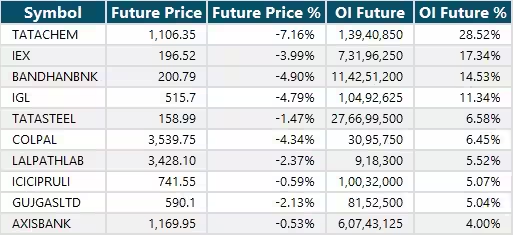
12) Short Build-up (50 Stocks)
50 stocks saw an increase in OI along with a fall in price, indicating a build-up of short positions.
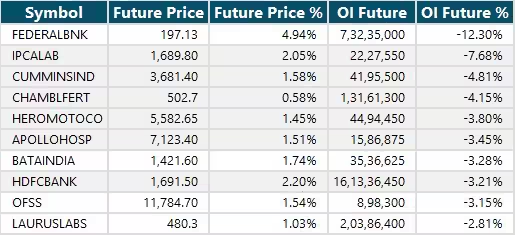
13) Short-Covering (61 Stocks)
61 stocks saw short-covering, meaning a decrease in OI, along with a price increase.
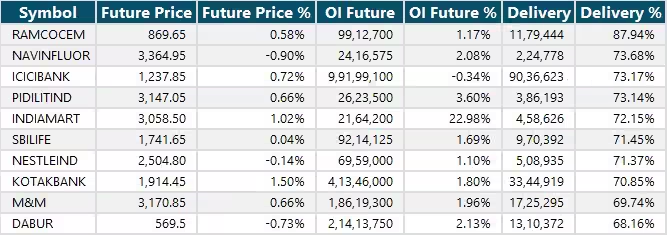
14) High Delivery Trades
Here are the stocks that saw a high share of delivery trades. A high share of delivery reflects investing (as opposed to trading) interest in a stock.
15) Stocks Under F&O Ban
Securities banned under the F&O segment include companies where derivative contracts cross 95 percent of the market-wide position limit.
Stocks added to F&O ban: Indian Energy Exchange, National Aluminium Company, Tata Chemicals
Stocks retained in F&O ban: Chambal Fertilisers and Chemicals, GNFC, Granules India, Hindustan Copper, IDFC First Bank, Manappuram Finance, Punjab National Bank, RBL Bank, SAIL
Stocks removed from F&O ban: Nil


0 Comment