14 Oct , 2024 By : Debdeep Gupta

Nifty Trade Setup
The rangebound trade with a flat close continued for the third consecutive session on October 11. In between, the Nifty 50 could not close above the 50-day EMA (Exponential Moving Average) of 25,050 amid struggles, while on the lower side, it defended the level of 24,900. At the same time, volatility dropped significantly from the week's high. Hence, if the index manages to climb decisively above the 50-day EMA, an up move towards 25,200-25,300 cannot be ruled out, with 24,900 as support. If it breaks this support, selling pressure may extend to last week's low of 24,700, according to experts.
Here are 15 data points we have collated to help you spot profitable trades:
1) Key Levels For The Nifty 50
Resistance based on pivot points: 25,012, 25,038, and 25,080
Support based on pivot points: 24,930, 24,904, and 24,862
Special Formation: The Nifty 50 formed a small bearish candlestick pattern with minor upper and lower shadows on the daily charts, indicating rangebound trade. On the weekly scale, there was a bearish candlestick pattern formation with long upper and lower shadows, resembling a High Wave pattern after a significant bear candle in the previous week, indicating a possible reduction in selling pressure.
2) Key Levels For The Bank Nifty
Resistance based on pivot points: 51,458, 51,589, and 51,800
Support based on pivot points: 51,034, 50,904, and 50,692
Resistance based on Fibonacci retracement: 51,828, 52,338
Support based on Fibonacci retracement: 50,269, 49,275
Special Formation: The Bank Nifty formed a bearish candlestick pattern on the daily charts following a 359-point fall to 51,172, with low volume. However, it continued to trade within last Monday's range (50,200-51,800) and below the 50-day EMA (51,750-51,800), which coincides with the upper end of Monday's range. The index was down 290 points for the week and recorded a bearish candle with a minor upper and long lower shadow on the weekly timeframe, indicating buying interest at lower levels while defending the 20-day EMA on a closing basis, which is a positive sign.
3) Nifty Call Options Data
According to the weekly options data, the maximum open interest was seen at 26,000 strikes (with 75.01 lakh contracts). This level can act as a key resistance level for the Nifty in the short term. It was followed by the 25,000 strike (57.84 lakh contracts) and the 25,500 strike (45.39 lakh contracts).
Maximum Call writing was observed at the 26,000 strike, which saw an addition of 23.66 lakh contracts, followed by the 25,000 and 25,800 strikes, which added 18.44 lakh and 12.23 lakh contracts, respectively. There was hardly any unwinding seen.
4) Nifty Put Options Data
On the Put side, the 25,000 strike holds the maximum open interest (with 49.66 lakh contracts), which can act as a key level for the Nifty. It was followed by the 24,000 strike (42.79 lakh contracts), and the 24,500 strike (27.73 lakh contracts).
The maximum Put writing was placed at the 24,000 strike, which saw an addition of 7.19 lakh contracts, followed by the 24,700, 24,100, and 24,900 strikes, with 7.09 lakh, 7.08 lakh and 7.05 lakh contracts added, respectively, while the Put unwinding was seen at the 25,100 strike, which shed 2.15 lakh contracts, followed by the 25,400, and 25,500 strikes, which shed 52,675 and 6,275 contracts, respectively.
5) Bank Nifty Call Options Data
According to the weekly options data, the maximum open interest was seen at the 52,000 strike, with 26.65 lakh contracts. This can act as a key resistance level for the index in the short term. It was followed by the 51,500 strike (22.27 lakh contracts) and the 52,500 strike (18.61 lakh contracts).
Maximum Call writing was visible at the 52,000 strikes (with the addition of 10.78 lakh contracts), followed by the 51,500 strikes (8.63 lakh contracts) and the 51,200 strikes (7.39 lakh contracts), while the maximum Call unwinding was seen at the 51,900 strike, which shed 70,860 contracts.
6) Bank Nifty Put Options Data
On the Put side, the 51,000 strike holds the maximum open interest (with 16.6 lakh contracts), which can act as a key support level for the index. This was followed by the 50,000 strike (13.96 lakh contracts) and the 50,500 strike (13.38 lakh contracts).
The maximum Put writing was observed at the 50,500 strikes (which added 1.85 lakh contracts), followed by the 50,600 strikes (1.46 lakh contracts) and the 50,800 strikes (1.4 lakh contracts), while the maximum Put unwinding was seen at the 51,500 strike, which shed 3.39 lakh contracts, followed by the 51,400 and 51,300 strikes which shed 2.8 lakh and 1.74 lakh contracts, respectively.
8) Put-Call Ratio
The Nifty Put-Call ratio (PCR), which indicates the mood of the market, fell to 0.84 on October 11, from 0.93 levels in the previous session.
The increasing PCR, or being higher than 0.7 or surpassing 1, means traders are selling more Put options than Call options, which generally indicates the firming up of a bullish sentiment in the market. If the ratio falls below 0.7 or moves towards 0.5, then it indicates selling in Calls is higher than selling in Puts, reflecting a bearish mood in the market.
9) India VIX
Volatility maintained its downward trend for the fourth straight session, dropping below all key moving averages, providing comfort for bulls to drive the uptrend. The India VIX, the fear indicator, was off its weekly high and closed at 13.22 on Friday, down 2.04 percent from the 13.50 levels on Thursday. For the week, it was down 6.42 percent compared to an 18.1 percent rally in the previous week.
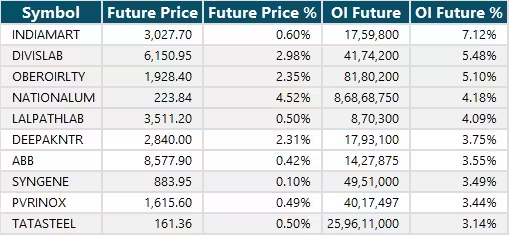
10) Long Build-up (50 Stocks)
A long build-up was seen in 50 stocks. An increase in open interest (OI) and price indicates a build-up of long positions.
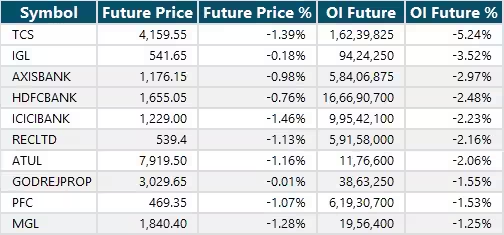
11) Long Unwinding (29 Stocks)
29 stocks saw a decline in open interest (OI) along with a fall in price, indicating long unwinding.
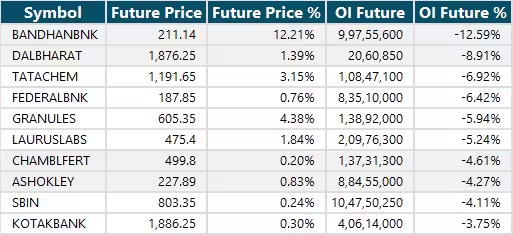
12) Short Build-up (47 Stocks)
47 stocks saw an increase in OI along with a fall in price, indicating a build-up of short positions.
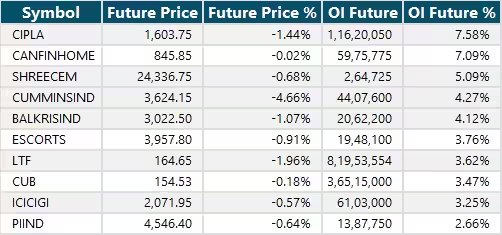
13) Short-Covering (56 Stocks)
56 stocks saw short-covering, meaning a decrease in OI, along with a price increase.
14) High Delivery Trades
Here are the stocks that saw a high share of delivery trades. A high share of delivery reflects investing (as opposed to trading) interest in a stock.
15) Stocks Under F&O Ban
Securities banned under the F&O segment include companies where derivative contracts cross 95 percent of the market-wide position limit.
Stocks added to F&O ban: Nil
Stocks retained in F&O ban: Chambal Fertilisers and Chemicals, GNFC, Granules India, Hindustan Copper, IDFC First Bank, Manappuram Finance, Punjab National Bank, RBL Bank, SAIL
Stocks removed from F&O ban: Bandhan Bank, Birlasoft, Tata Chemicals


0 Comment