12 Aug , 2025 By : Debdeep Gupta

The Nifty 50 staged a stellar rally on August 11, rising 222 points and recouping almost all of the previous day's losses. This marked a strong start to the week, and a bullish trend reversal formation appeared to be taking shape. However, it still requires follow-through and sustainable buying in upcoming sessions, particularly by taking support at 24,330. If the index extends gains up to 24,650 (the immediate hurdle) and marches toward the crucial resistance zone of 24,800–24,850 — and sustains there — a major upmove cannot be ruled out. However, failure to do so could lead to continued consolidation, with support at 24,330, followed by 24,200 (the 200-day EMA), according to experts.
Here are 15 data points we have collated to help you spot profitable trades:
1) Key Levels For The Nifty 50 (24,585)
Resistance based on pivot points: 24,608, 24,668, and 24,765
Support based on pivot points: 24,414, 24,355, and 24,258
Special Formation: The Nifty 50 formed a long bullish candle on the daily charts, resembling a Tweezer Bottom (a trend reversal pattern), as well as a Double Bottom on the hourly charts. However, both patterns require strong and sustained follow-through buying for confirmation. The index closed just below the 100-day EMA (24,591) after remaining within the previous day's range. The RSI stood at 41.92, and the Stochastic RSI showed a positive crossover. Meanwhile, histogram weakness faded, but the MACD remained below the zero line. This indicates early signs of a potential reversal, but confirmation is still awaited.
2) Key Levels For The Bank Nifty (55,511)
Resistance based on pivot points: 55,590, 55,745, and 55,995
Support based on pivot points: 55,090, 54,936, and 54,686
Resistance based on Fibonacci retracement: 55,947, 56,271
Support based on Fibonacci retracement: 54,386, 53,392
Special Formation: The Bank Nifty also formed a bullish candle, almost entirely within the previous day's red candle, while consistently holding above the 100-day EMA on a closing basis for another session. The RSI, at 41.96, is on the verge of a positive crossover, and the Stochastic RSI maintained a bullish crossover, though still in the oversold zone. Histogram weakness reduced slightly, but the MACD stayed below the zero line. This indicates an improving structure, but it needs follow-through to strengthen bullish sentiment.
3) Nifty Call Options Data
According to the weekly options data, the maximum Call open interest was seen at the 25,000 strike (with 1.09 crore contracts). This level can act as a key resistance for the Nifty in the short term. It was followed by the 24,600 strike (82.31 lakh contracts), and the 24,800 strike (67.73 lakh contracts).
Maximum Call writing was observed at the 25,050 strike, which saw an addition of 5.57 lakh contracts, followed by the 25,100 and 24,850 strikes, which added 1.26 lakh and 15,675 contracts, respectively. The maximum Call unwinding was seen at the 24,500 strike, which shed 57.46 lakh contracts, followed by the 24,600 and 24,400 strikes, which shed 2.21 lakh and 2.18 lakh contracts, respectively.
4) Nifty Put Options Data
On the Put side, the 24,400 strike holds the maximum Put open interest (with 96.03 lakh contracts), which can act as a key support level for the Nifty. It was followed by the 24,500 strike (91.35 lakh contracts) and the 24,000 strike (90.28 lakh contracts).
The maximum Put writing was placed at the 24,400 strike, which saw an addition of 57.13 lakh contracts, followed by the 24,500 and 24,000 strikes, which added 43.49 lakh and 33.34 lakh contracts, respectively. The maximum Put unwinding was seen at the 24,900 strike, which shed 66,225 contracts, followed by the 25,000 and 25,100 strikes, which shed 45,075 and 26,025 contracts, respectively.
5) Bank Nifty Call Options Data
According to the monthly options data, the 57,000 strike holds the maximum Call open interest, with 22.68 lakh contracts. This can act as a key resistance level for the index in the short term. It was followed by the 56,000 strike (13.04 lakh contracts) and the 55,500 strike (9.63 lakh contracts).
Maximum Call writing was observed at the 55,700 strike (with the addition of 19,950 contracts), followed by the 57,400 strike (9,030 contracts), and the 56,700 strike (8,015 contracts). The maximum Call unwinding was seen at the 55,000 strike, which shed 1.44 lakh contracts, followed by the 56,000 and 55,200 strikes, which shed 1.23 lakh and 72,905 contracts, respectively.
6) Bank Nifty Put Options Data
On the Put side, the maximum Put open interest was placed at the 57,000 strike (with 13.23 lakh contracts), which can act as a key level for the index. This was followed by the 55,000 strike (9.81 lakh contracts) and the 54,000 strike (9.05 lakh contracts).
The maximum Put writing was observed at the 54,900 strike (which added 73,500 contracts), followed by the 55,200 strike (54,180 contracts) and the 55,300 strike (48,650 contracts). The maximum Put unwinding was seen at the 54,000 strike, which shed 78,330 contracts, followed by the 56,000 and 57,000 strikes, which shed 68,845 and 9,555 contracts, respectively.
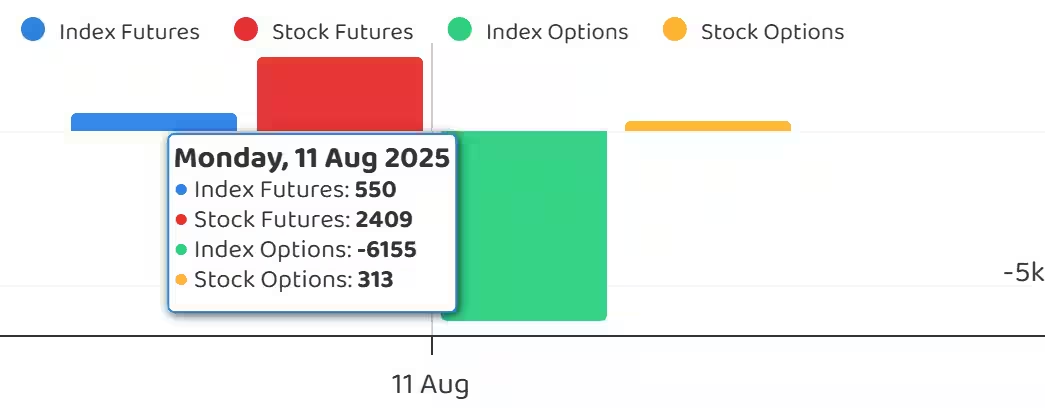
7) Funds Flow (Rs crore)
8) Put-Call Ratio
The Nifty Put-Call ratio (PCR), which indicates the mood of the market, jumped to 1.03 on August 11, compared to 0.66 in the previous session.
The increasing PCR, or being higher than 0.7 or surpassing 1, means traders are selling more Put options than Call options, which generally indicates the firming up of a bullish sentiment in the market. If the ratio falls below 0.7 or moves towards 0.5, then it indicates selling in Calls is higher than selling in Puts, reflecting a bearish mood in the market.
9) India VIX
The fear gauge, India VIX, extended its upward journey for another session, climbing to an intraday high of 12.73 before closing at 12.22, up 1.54 percent. The index sustained above short-term moving averages, signalling caution for bulls.
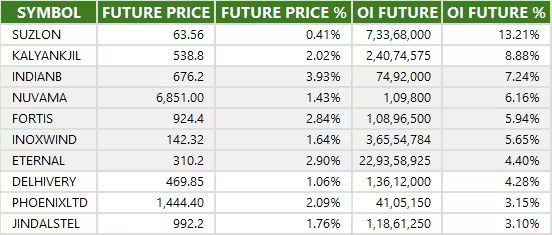
10) Long Build-up (81 Stocks)
A long build-up was seen in 81 stocks. An increase in open interest (OI) and price indicates a build-up of long positions.
11) Long Unwinding (17 Stocks)
17 stocks saw a decline in open interest (OI) along with a fall in price, indicating long unwinding.
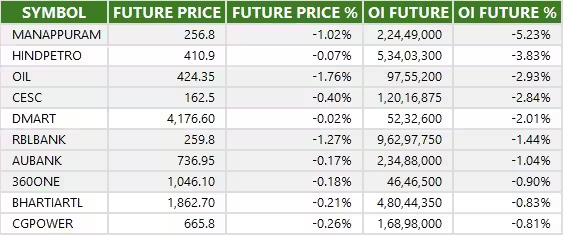
12) Short Build-up (32 Stocks)
32 stocks saw an increase in OI along with a fall in price, indicating a build-up of short positions.
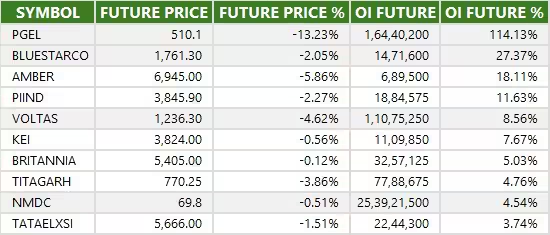
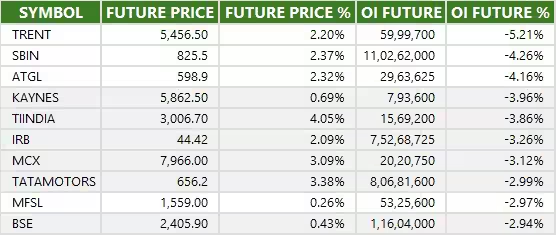
13) Short-Covering (88 Stocks)
88 stocks saw short-covering, meaning a decrease in OI, along with a price increase.
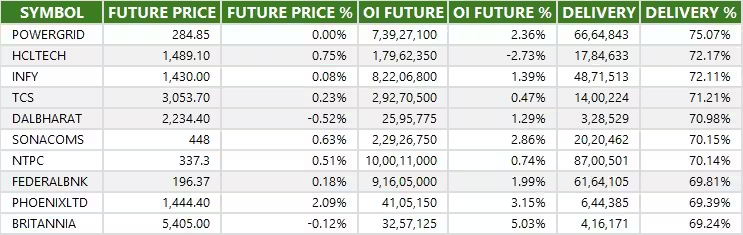
14) High Delivery Trades
Here are the stocks that saw a high share of delivery trades. A high share of delivery reflects investing (as opposed to trading) interest in a stock.
15) Stocks Under F&O Ban
Securities banned under the F&O segment include companies where derivative contracts cross 95 percent of the market-wide position limit.
Stocks added to F&O ban: PG Electroplast
Stocks retained in F&O ban: PNB Housing Finance, RBL Bank
Stocks removed from F&O ban: Nil


0 Comment