11 Aug , 2025 By : Debdeep Gupta

The Nifty 50 failed to see follow-through buying on August 8 due to selling pressure and ended at a three-month low, losing 233 points amid growing concerns over the impact of US tariffs on Indian exports. The index had already been trading below short- to medium-term moving averages and has now slipped below the 100-day EMA, accompanied by weakness in momentum indicators — signaling a bearish outlook. If the index breaks below the 200-day EMA (24,200) in the upcoming sessions, the 50-week EMA (24,000) could be the next possible level. On the higher side, however, the 24,500 mark is likely to act as a resistance, according to experts.
Here are 15 data points we have collated to help you spot profitable trades:
1) Key Levels For The Nifty 50 (24,363)
Resistance based on pivot points: 24,523, 24,582, and 24,677
Support based on pivot points: 24,334, 24,276, and 24,181
Special Formation: The Nifty 50 formed a bearish candle with a minor upper shadow on the daily charts (beside the previous day's green candle), indicating weakness and selling pressure at the 100-day EMA. The index continued its correction for the sixth consecutive week — marking the longest losing streak since the COVID-19 pandemic in 2020. It maintained a lower highs–lower lows structure and traded near the lower band of the Bollinger Bands. Momentum indicators reflected continued weakness, with the RSI at 33.58, drifting toward the oversold zone, and MACD remained below the zero line, with continued weakness in the histogram.
2) Key Levels For The Bank Nifty (55,005)
Resistance based on pivot points: 55,473, 55,649, and 55,935
Support based on pivot points: 54,902, 54,726, and 54,441
Resistance based on Fibonacci retracement: 55,530, 55,927
Support based on Fibonacci retracement: 54,390, 53,390
Special Formation: The Bank Nifty tested the 100-day EMA and formed a long bearish candle, resembling a bearish engulfing pattern on the daily timeframe — a sign that bears are in control. The banking index also remained below both short-term and medium-term moving averages. Momentum indicators showed bearish signals, with the MACD sustaining below the zero line with a downward bias in the histogram, and the RSI at 33.25, moving closer to the oversold area. This suggests further downside risk for the index.
3) Nifty Call Options Data
According to the weekly options data, the 25,000 strike holds the maximum Call open interest (with 1.24 crore contracts). This level can act as a key resistance for the Nifty in the short term. It was followed by the 24,500 strike (1.1 crore contracts), and the 24,600 strike (1.04 crore contracts).
Maximum Call writing was observed at the 24,500 strike, which saw an addition of 84.94 lakh contracts, followed by the 24,600 and 25,000 strikes, which added 73.72 lakh and 70.8 lakh contracts, respectively. There was hardly any Call unwinding seen in the 23,600-25,250 strike band.
4) Nifty Put Options Data
On the Put side, the maximum Put open interest was seen at the 24,000 strike (with 56.94 lakh contracts), which can act as a key support level for the Nifty. It was followed by the 24,500 strike (47.86 lakh contracts) and the 24,300 strike (47.12 lakh contracts).
The maximum Put writing was placed at the 24,300 strike, which saw an addition of 22.17 lakh contracts, followed by the 24,000 and 23,700 strikes, which added 10.75 lakh and 10.11 lakh contracts, respectively. The maximum Put unwinding was seen at the 24,600 strike, which shed 8.21 lakh contracts, followed by the 24,650 and 24,550 strikes, which shed 5.11 lakh and 2.44 lakh contracts, respectively.
5) Bank Nifty Call Options Data
According to the monthly options data, the maximum Call open interest was seen at the 57,000 strike, with 22.96 lakh contracts. This can act as a key resistance level for the index in the short term. It was followed by the 56,000 strike (14.27 lakh contracts) and the 55,500 strike (10.27 lakh contracts).
Maximum Call writing was observed at the 55,500 strike (with the addition of 3.02 lakh contracts), followed by the 55,000 strike (2.11 lakh contracts), and the 56,000 strike (1.79 lakh contracts). There was hardly any Call unwinding seen in the 53,250-57,100 strike band.
6) Bank Nifty Put Options Data
On the Put side, the 57,000 strike holds the maximum Put open interest (with 13.32 lakh contracts), which can act as a key level for the index. This was followed by the 54,000 strike (9.83 lakh contracts) and the 55,000 strike (9.33 lakh contracts).
The maximum Put writing was observed at the 53,500 strike (which added 1.02 lakh contracts), followed by the 55,500 strike (67,095 contracts) and the 54,000 strike (49,910 contracts). The maximum Put unwinding was seen at the 56,700 strike, which shed 40,355 contracts, followed by the 55,700 and 55,300 strikes, which shed 36,750 and 36,120 contracts, respectively.
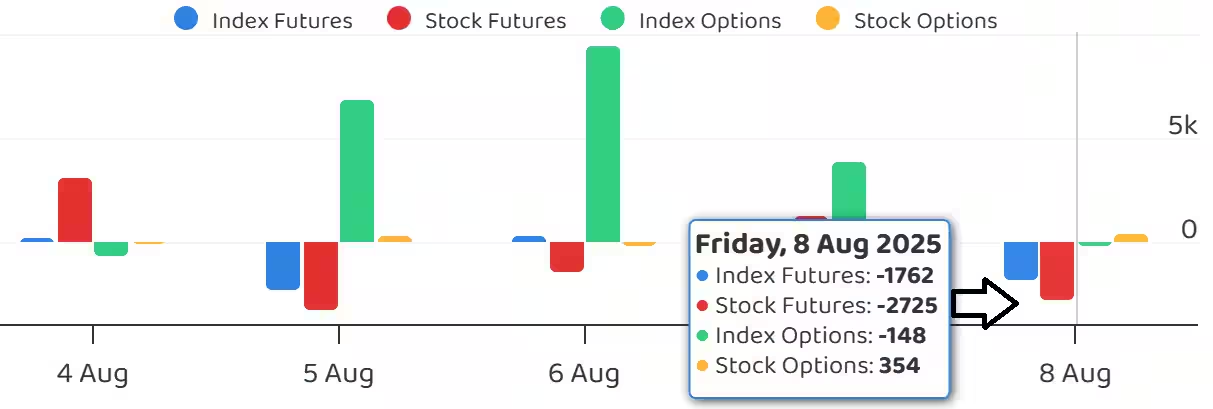
7) Funds Flow (Rs crore)
8) Put-Call Ratio
The Nifty Put-Call ratio (PCR), which indicates the mood of the market, fell sharply to 0.66 on August 8 (the lowest since July 28), compared to 1.06 in the previous session.
The increasing PCR, or being higher than 0.7 or surpassing 1, means traders are selling more Put options than Call options, which generally indicates the firming up of a bullish sentiment in the market. If the ratio falls below 0.7 or moves towards 0.5, then it indicates selling in Calls is higher than selling in Puts, reflecting a bearish mood in the market.
9) India VIX
India VIX, which measures expected market volatility, rose by 2.95 percent to 12.03, and traded above short-term moving averages — signaling a bit of caution for the bulls.
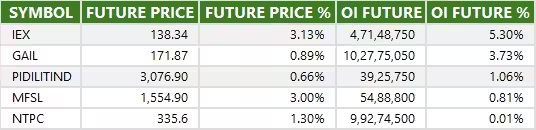
10) Long Build-up (5 Stocks)
A long build-up was seen in 5 stocks. An increase in open interest (OI) and price indicates a build-up of long positions.
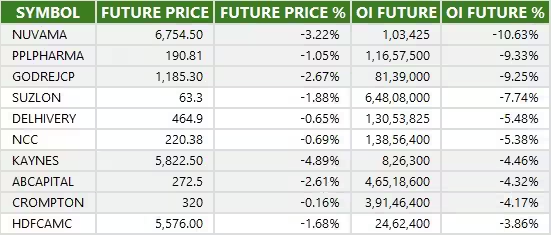
11) Long Unwinding (81 Stocks)
81 stocks saw a decline in open interest (OI) along with a fall in price, indicating long unwinding.
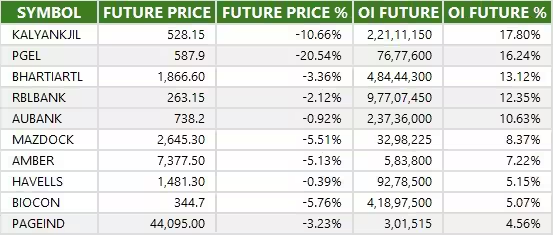
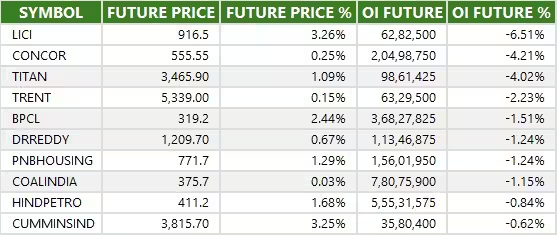
12) Short Build-up (119 Stocks)
119 stocks saw an increase in OI along with a fall in price, indicating a build-up of short positions.
13) Short-Covering (14 Stocks)
14 stocks saw short-covering, meaning a decrease in OI, along with a price increase.
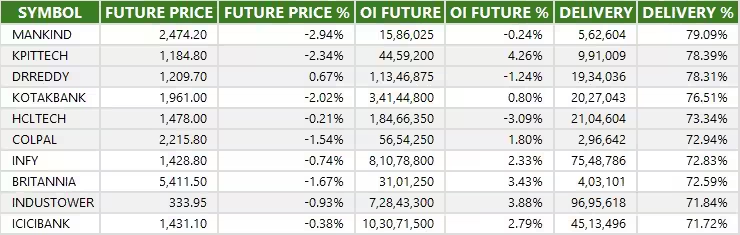
14) High Delivery Trades
Here are the stocks that saw a high share of delivery trades. A high share of delivery reflects investing (as opposed to trading) interest in a stock.
15) Stocks Under F&O Ban
Securities banned under the F&O segment include companies where derivative contracts cross 95 percent of the market-wide position limit.
Stocks added to F&O ban: RBL Bank
Stocks retained in F&O ban: PNB Housing Finance
Stocks removed from F&O ban: Nil


0 Comment