09 May , 2025 By : Debdeep Gupta

The Nifty 50 slipped into the red after a day of healthy trading the previous day, falling 0.6 percent with above-average volumes, following the escalation of tensions between India and Pakistan on May 8. According to experts, the underlying trend of the index is weak, with an elevated VIX and momentum indicators tilting downward. The index breached the 24,200 level intraday, and if this level is decisively broken in the upcoming session, the correction may extend toward the 24,000–23,850 range. However, on the higher side, the 24,400–24,450 zone remains the key resistance area to watch.
Here are 15 data points we have collated to help you spot profitable trades:
1) Key Levels For The Nifty 50 (24,274)
Resistance based on pivot points: 24,404, 24,474, and 24,587
Support based on pivot points: 24,177, 24,107, and 23,993
Special Formation: The Nifty 50 formed a bearish candlestick pattern on the daily charts, following the previous day's long bullish candle, signaling a sharp reversal to the downside. The momentum indicators — the RSI (Relative Strength Index), at 60.89, is above the 60 mark but is tilting downward. The MACD (Moving Average Convergence Divergence) is also trending downward, and the Stochastic RSI has already shown a negative crossover, falling below the 50 zone.
2) Key Levels For The Bank Nifty (54,366)
Resistance based on pivot points: 54,787, 54,983, and 55,300
Support based on pivot points: 54,154, 53,958, and 53,641
Resistance based on Fibonacci retracement: 56,253, 58,579
Support based on Fibonacci retracement: 52,918, 51,924
Special Formation: The Bank Nifty also reported a bearish candle on the daily timeframe with above-average volumes. The RSI, at 58.46, is trending downward. The MACD has maintained a negative crossover (though still above the zero line), with a weakening Histogram. The index dropped below its short-term moving averages (the 5 and 10-day EMAs) and is approaching the 20-day EMA.
3) Nifty Call Options Data
According to the weekly options data, the 25,000 strike holds the maximum Call open interest (with 46.14 lakh contracts). This level can act as a key resistance for the Nifty in the short term. It was followed by the 24,400 strike (34.1 lakh contracts), and the 24,500 strike (31.99 lakh contracts).
Maximum Call writing was observed at the 25,000 strike, which saw an addition of 26.17 lakh contracts, followed by the 24,400 and 24,300 strikes, which added 16.02 lakh and 15.62 lakh contracts, respectively. There was hardly any Call unwinding seen in the 23,300-25,250 strike band.
4) Nifty Put Options Data
On the Put side, the maximum Put open interest was seen at the 24,000 strike (with 39.26 lakh contracts), which can act as a key support level for the Nifty. It was followed by the 23,800 strike (26.95 lakh contracts) and the 23,500 strike (26.93 lakh contracts).
The maximum Put writing was placed at the 24,000 strike, which saw an addition of 17.03 lakh contracts, followed by the 24,200 and 24,300 strikes, which added 10.89 lakh and 9.26 lakh contracts, respectively. The Put unwinding was seen at the 24,500 strike, which shed 5.38 lakh contracts, followed by the 23,550 and 23,700 strikes which shed 2.87 lakh and 30,675 contracts, respectively.
5) Bank Nifty Call Options Data
According to the monthly options data, the 55,500 strike holds the maximum Call open interest, with 10.44 lakh contracts. This can act as a key resistance level for the index in the short term. It was followed by the 55,000 strike (9.89 lakh contracts) and the 56,000 strike (9.65 lakh contracts).
Maximum Call writing was visible at the 54,000 strike (with the addition of 1.82 lakh contracts), followed by the 56,000 strike (92,040 contracts) and the 54,800 strike (85,560 contracts). The maximum Call unwinding was seen at the 53,500 strike, which shed 1.26 lakh contracts, followed by the 53,000 and 55,500 strikes, which shed 60,870 and 51,150 contracts, respectively.
6) Bank Nifty Put Options Data
On the Put side, the maximum Put open interest was seen at the 54,000 strike (with 18.19 lakh contracts), which can act as a key support level for the index. This was followed by the 53,000 strike (13.24 lakh contracts) and the 55,500 strike (7.3 lakh contracts).
The maximum Put writing was observed at the 54,000 strike (which added 3.58 lakh contracts), followed by the 54,800 strike (29,430 contracts) and the 52,900 strike (22,620 contracts). The maximum Put unwinding was seen at the 53,500 strike, which shed 4.84 lakh contracts, followed by the 55,000 and 54,500 strikes, which shed 79,110 and 53,580 contracts, respectively.
7) Funds Flow (Rs crore)

8) Put-Call Ratio
The Nifty Put-Call ratio (PCR), which indicates the mood of the market, jumped to 1.08 on May 8, from 0.97 in the previous session.
The increasing PCR, or being higher than 0.7 or surpassing 1, means traders are selling more Put options than Call options, which generally indicates the firming up of a bullish sentiment in the market. If the ratio falls below 0.7 or moves towards 0.5, then it indicates selling in Calls is higher than selling in Puts, reflecting a bearish mood in the market.
9) India VIX
The India VIX, the fear index, surged by 10.22 percent to 21.01, marking the highest level since April 9. This clearly indicates significant caution for bulls, as the trend seems to be turning more favorable for bears.
10) Long Build-up (8 Stocks)
A long build-up was seen in 8 stocks. An increase in open interest (OI) and price indicates a build-up of long positions.

11) Long Unwinding (112 Stocks)
112 stocks saw a decline in open interest (OI) along with a fall in price, indicating long unwinding.
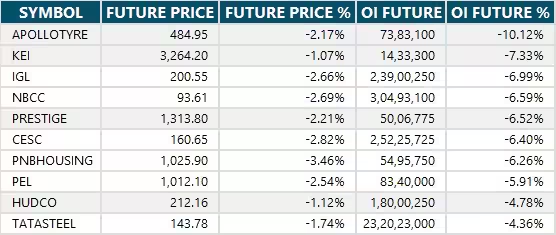
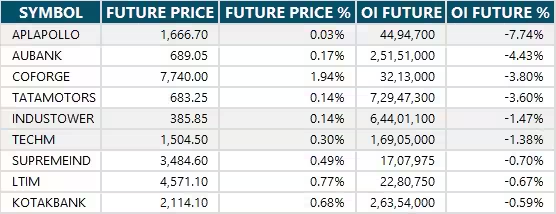
12) Short Build-up (89 Stocks)
89 stocks saw an increase in OI along with a fall in price, indicating a build-up of short positions.

13) Short-Covering (9 Stocks)
9 stocks saw short-covering, meaning a decrease in OI, along with a price increase.
14) High Delivery Trades
Here are the stocks that saw a high share of delivery trades. A high share of delivery reflects investing (as opposed to trading) interest in a stock.

15) Stocks Under F&O Ban
Securities banned under the F&O segment include companies where derivative contracts cross 95 percent of the market-wide position limit.
Stocks added to F&O ban: Nil
Stocks retained in F&O ban: Central Depository Services, Manappuram Finance, RBL Bank
Stocks removed from F&O ban: Nil


0 Comment