28 May , 2025 By : Debdeep Gupta

The Nifty 50 snapped a two-day winning streak and closed 0.7 percent lower with above-average volumes on May 27, amid profit booking. The index once again failed to surpass the falling resistance trendline on a closing basis, which remains a crucial barrier for any further upward movement. However, it continued to sustain above all key moving averages, which is a positive sign. According to experts, if the index manages to defend the support zone at 24,700 in the upcoming sessions, an upside toward the 25,100–25,200 range is possible. Conversely, a decisive fall below 24,700 could drag the index down to the 24,500–24,450 levels.
Here are 15 data points we have collated to help you spot profitable trades:
1) Key Levels For The Nifty 50 (24,826)
Resistance based on pivot points: 25,001, 25,086, and 25,223
Support based on pivot points: 24,727, 24,643, and 24,506
Special Formation: The Nifty 50 formed a bearish candle with both upper and lower shadows on the daily chart, indicating selling pressure at higher levels and buying interest at lower levels. The index managed to defend its 10-day EMA and sustained above all key moving averages. The Relative Strength Index (RSI) remained above the 50 mark at 57.63, although it showed a downward tilt. The MACD (Moving Average Convergence Divergence) stayed above the zero line, but a negative crossover was observed, indicating some weakness in momentum.
2) Key Levels For The Bank Nifty (55,353)
Resistance based on pivot points: 55,710, 55,898, and 56,201
Support based on pivot points: 55,104, 54,917, and 54,614
Resistance based on Fibonacci retracement: 56,307, 58,648
Support based on Fibonacci retracement: 54,117, 52,892
Special Formation: The Bank Nifty formed a long-legged doji-like candlestick pattern on the daily timeframe, reflecting indecision among bulls and bears for yet another session. The index sustained above all key moving averages, which is a technical positive. However, the RSI trended downward and showed a negative crossover, though it still remained above the 50 mark at 58.55. The MACD also maintained a negative crossover but stayed above the zero line, suggesting that momentum is weakening, though not yet in negative territory.
3) Nifty Call Options Data
According to the monthly options data, the maximum Call open interest was seen at the 25,000 strike (with 1.27 crore contracts). This level can act as a key resistance for the Nifty in the short term. It was followed by the 25,500 strike (97.95 lakh contracts), and the 25,800 strike (74.86 lakh contracts).
Maximum Call writing was observed at the 24,800 strike, which saw an addition of 41.04 lakh contracts, followed by the 25,500 and 24,900 strikes, which added 33.42 lakh and 32.54 lakh contracts, respectively. The maximum Call unwinding was seen at the 24,650 strike, which shed 52,875 contracts, followed by the 24,400 and 24,600 strikes, which shed 45,825 and 45,450 contracts, respectively.
4) Nifty Put Options Data
On the Put side, the 24,000 strike holds the maximum Put open interest (with 1.16 crore contracts), which can act as a key support level for the Nifty. It was followed by the 24,500 strike (86.41 lakh contracts) and the 24,200 strike (84.55 lakh contracts).
The maximum Put writing was placed at the 24,200 strike, which saw an addition of 24.93 lakh contracts, followed by the 24,800 and 24,400 strikes, which added 10.3 lakh and 9.22 lakh contracts, respectively. The Put unwinding was seen at the 24,500 strike, which shed 12.93 lakh contracts, followed by the 24,000 and 24,950 strikes which shed 7.86 lakh and 7.48 lakh contracts, respectively.
5) Bank Nifty Call Options Data
According to the monthly options data, the maximum Call open interest was seen at the 56,000 strike, with 17.12 lakh contracts. This can act as a key resistance level for the index in the short term. It was followed by the 55,500 strike (15.63 lakh contracts) and the 57,000 strike (15 lakh contracts).
Maximum Call writing was visible at the 57,500 strike (with the addition of 3.33 lakh contracts), followed by the 56,500 strike (2.89 lakh contracts), and the 55,500 strike (2.24 lakh contracts). The maximum Call unwinding was seen at the 55,900 strike, which shed 64,950 contracts, followed by the 56,800 and 55,800 strikes, which shed 46,500 and 44,370 contracts, respectively.
6) Bank Nifty Put Options Data
On the Put side, the 55,000 strike holds the maximum Put open interest (with 15.51 lakh contracts), which can act as a key support level for the index. This was followed by the 55,500 strike (14.26 lakh contracts) and the 54,000 strike (13.53 lakh contracts).
The maximum Put writing was observed at the 53,500 strike (which added 2.39 lakh contracts), followed by the 54,500 strike (94,710 contracts) and the 55,300 strike (63,960 contracts). The maximum Put unwinding was seen at the 55,000 strike, which shed 99,870 contracts, followed by the 54,600 and 54,200 strikes, which shed 50,400 and 31,740 contracts, respectively.
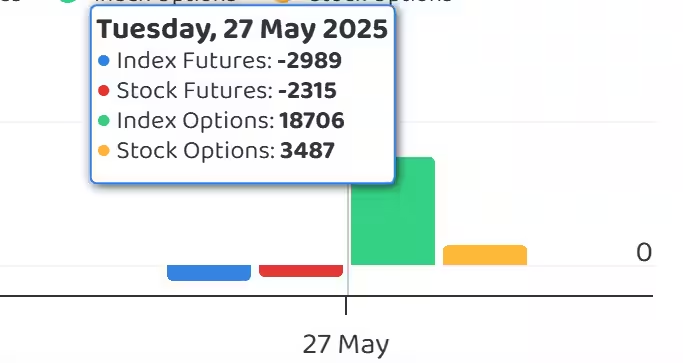
7) Funds Flow (Rs crore)
8) Put-Call Ratio
The Nifty Put-Call ratio (PCR), which indicates the mood of the market, dropped to 0.82 on May 27, from 1.06 in the previous session.
The increasing PCR, or being higher than 0.7 or surpassing 1, means traders are selling more Put options than Call options, which generally indicates the firming up of a bullish sentiment in the market. If the ratio falls below 0.7 or moves towards 0.5, then it indicates selling in Calls is higher than selling in Puts, reflecting a bearish mood in the market.
9) India VIX
The India VIX, which measures expected market volatility, continued its upward trajectory and crossed the 18 mark. It rose by 2.86 percent to 18.54 levels, signaling caution for the bulls. The elevated VIX suggests increased nervousness in the market, potentially pointing to volatility ahead.
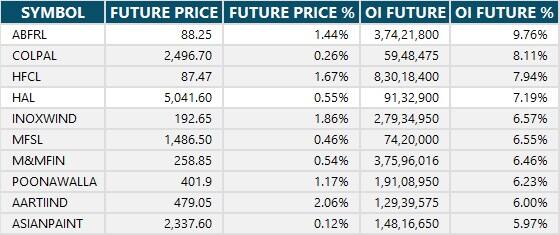
10) Long Build-up (54 Stocks)
A long build-up was seen in 54 stocks. An increase in open interest (OI) and price indicates a build-up of long positions.
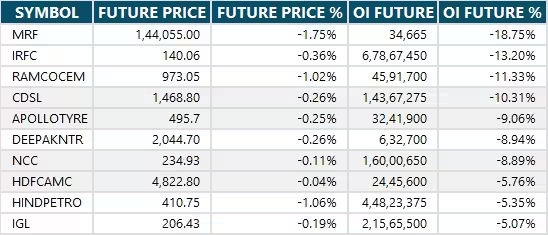
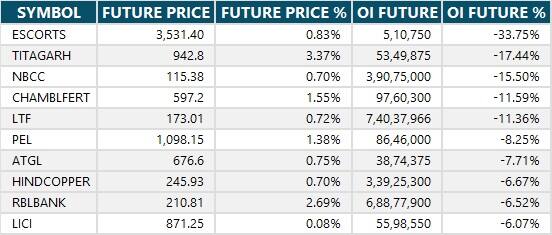
11) Long Unwinding (48 Stocks)
48 stocks saw a decline in open interest (OI) along with a fall in price, indicating long unwinding.
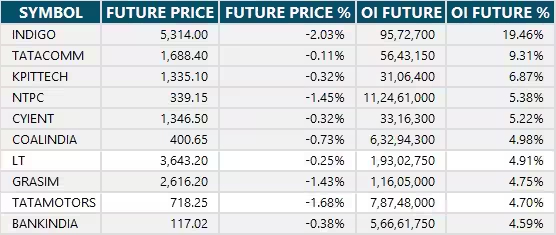
12) Short Build-up (65 Stocks)
65 stocks saw an increase in OI along with a fall in price, indicating a build-up of short positions.
13) Short-Covering (53 Stocks)
53 stocks saw short-covering, meaning a decrease in OI, along with a price increase.
14) High Delivery Trades
Here are the stocks that saw a high share of delivery trades. A high share of delivery reflects investing (as opposed to trading) interest in a stock.

15) Stocks Under F&O Ban
Securities banned under the F&O segment include companies where derivative contracts cross 95 percent of the market-wide position limit.
Stocks added to F&O ban: Nil
Stocks retained in F&O ban: RBL Bank
Stocks removed from F&O ban: Chambal Fertilisers and Chemicals, Hindustan Copper, Manappuram Finance, Titagarh Rail Systems


0 Comment