04 Feb , 2025 By : Debdeep Gupta

The Nifty 50 slipped into the red on January 3, after the volatility seen on Budget Day, making a negative start to the week by closing 0.5% lower. However, the index recovered more than half of its intraday losses and defended its short-term moving averages (10, 20-day EMAs) as well as the midline of Bollinger Bands on a closing basis, which is a positive sign. According to experts, the index seems to be in the process of forming a new higher bottom in the short term, especially after climbing above the last lower high (23,426). If the index stays above 23,000, an upside bounce toward 23,600 (200-day EMA) can't be ruled out; however, immediate support is at 23,200.
Here are 15 data points we have collated to help you spot profitable trades:
1) Key Levels For The Nifty 50 (23,361)
Resistance based on pivot points: 23,383, 23,420, and 23,481
Support based on pivot points: 23,261, 23,223, and 23,162
Special Formation: The Nifty 50 reported a bullish candle with a lower shadow on the daily charts, indicating buying interest at lower levels. The index not only defended its short-term moving averages but also the midline of Bollinger Bands on a closing basis, with above-average volumes, which is a positive sign. However, it negated the higher highs-higher lows formation of the last five days.
2) Key Levels For The Bank Nifty (49,211)
Resistance based on pivot points: 49,342, 49,452, and 49,631
Support based on pivot points: 48,985, 48,875, and 48,696
Resistance based on Fibonacci retracement: 49,409, 50,368
Support based on Fibonacci retracement: 47,875, 46,078
Special Formation: The Bank Nifty showed a 300-point recovery from the day's low by defending 48,900 (the Budget Day's low) as well as the midline of Bollinger Bands before closing 0.6% down. It formed a Tweezer Bottom kind of pattern on the daily charts, a bullish reversal pattern. For confirmation, one would need to wait for the action of the following session. The index formed a bullish candlestick pattern with minor upper and lower shadows on the daily charts, indicating volatility, though it negated the higher highs formation of the previous three sessions.
3) Nifty Call Options Data
According to the weekly options data, the 24,000 strike holds the maximum Call open interest (with 1.82 crore contracts). This level can act as a key resistance for the Nifty in the short term. It was followed by the 24,500 strike (1.27 crore contracts) and the 23,500 strike (1.23 crore contracts).
Maximum Call writing was observed at the 23,500 strike, which saw an addition of 46.81 lakh contracts, followed by the 24,000 and 24,500 strikes, which added 45.97 lakh and 34.32 lakh contracts, respectively. The maximum Call unwinding was seen at the 23,800 strike which shed 8.54 lakh contracts, followed by the 24,400 and 24,550 strikes which shed 2.99 lakh and 2.32 lakh contracts, respectively.
4) Nifty Put Options Data
On the Put side, the maximum Put open interest was seen at the 23,000 strike (with 89.35 lakh contracts), which can act as a key support level for the Nifty. It was followed by the 22,500 strike (82.49 lakh contracts) and the 23,300 strike (74.53 lakh contracts).
The maximum Put writing was placed at the 23,300 strike, which saw an addition of 18.56 lakh contracts, followed by the 22,800 and 22,500 strikes, which added 17.39 lakh and 15.44 lakh contracts, respectively. The maximum Put unwinding was seen at the 23,500 strike, which shed 11.83 lakh contracts, followed by the 23,450 and 23,600 strikes, which shed 1.42 lakh and 95,850 contracts, respectively.
5) Bank Nifty Call Options Data
According to the monthly options data, the 51,000 strike holds the maximum Call open interest, with 12.87 lakh contracts. This can act as a key resistance level for the index in the short term. It was followed by the 50,000 strike (9.75 lakh contracts) and the 49,000 strike (7.31 lakh contracts).
Maximum Call writing was visible at the 51,000 strike (with the addition of 4.45 lakh contracts), followed by the 50,000 strike (1.34 lakh contracts) and the 49,500 strike (1.23 lakh contracts). The maximum Call unwinding was seen at the 49,800 strike, which shed 19,080 contracts, followed by the 48,600 and 47,900 strikes, which shed 16,170 and 1,500 contracts, respectively.
6) Bank Nifty Put Options Data
On the Put side, the maximum Put open interest was seen at the 49,000 strike (with 12.1 lakh contracts), which can act as a key support level for the index. This was followed by the 48,000 strike (7.23 lakh contracts) and the 50,000 strike (6.32 lakh contracts).
The maximum Put writing was observed at the 50,500 strike (which added 1.52 lakh contracts), followed by the 49,000 strike (1.23 lakh contracts) and the 47,500 strike (70,920 contracts). The maximum Put unwinding was seen at the 49,600 strike, which shed 17,910 contracts, followed by the 49,800 and 51,000 strikes which shed 10,170 and 4,650 contracts, respectively.
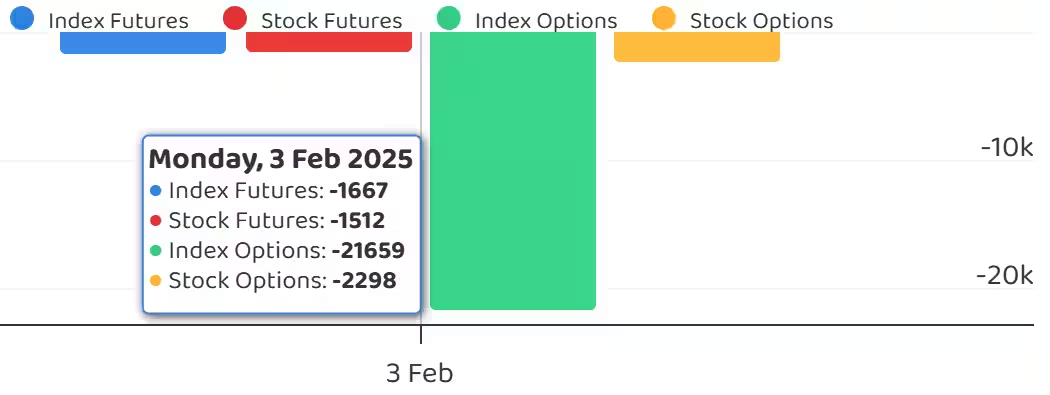
7) Funds Flow (Rs crore)
8) Put-Call Ratio
The Nifty Put-Call ratio (PCR), which indicates the mood of the market, remained flat at 0.87 on February 3, compared to the previous session.
The increasing PCR, or being higher than 0.7 or surpassing 1, means traders are selling more Put options than Call options, which generally indicates the firming up of a bullish sentiment in the market. If the ratio falls below 0.7 or moves towards 0.5, then it indicates selling in Calls is higher than selling in Puts, reflecting a bearish mood in the market.
9) India VIX
The India VIX, the fear index which measures the expected market volatility, rebounded 1.83% to 14.35 after a sharp fall in the previous three consecutive sessions. However, it remains in the lower zone and below all key moving averages, providing comfort for the bulls.
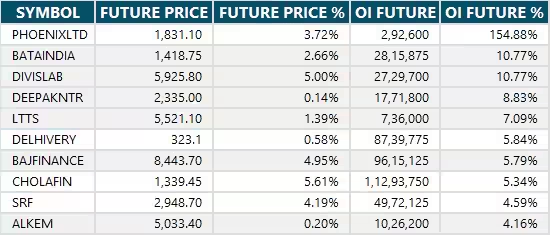
10) Long Build-up (39 Stocks)
A long build-up was seen in 39 stocks. An increase in open interest (OI) and price indicates a build-up of long positions.
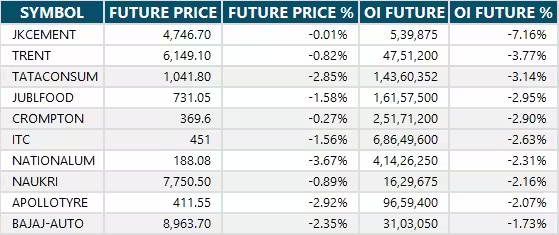
11) Long Unwinding (47 Stocks)
47 stocks saw a decline in open interest (OI) along with a fall in price, indicating long unwinding.
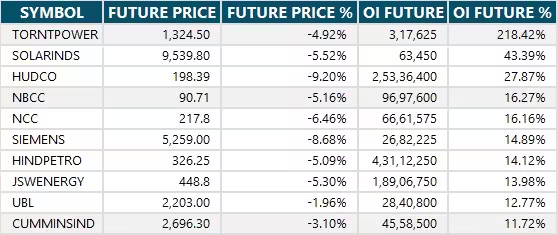
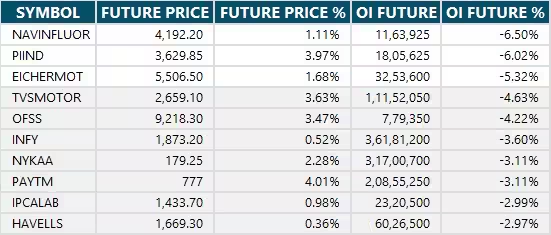
12) Short Build-up (113 Stocks)
113 stocks saw an increase in OI along with a fall in price, indicating a build-up of short positions.
13) Short-Covering (33 Stocks)
33 stocks saw short-covering, meaning a decrease in OI, along with a price increase.
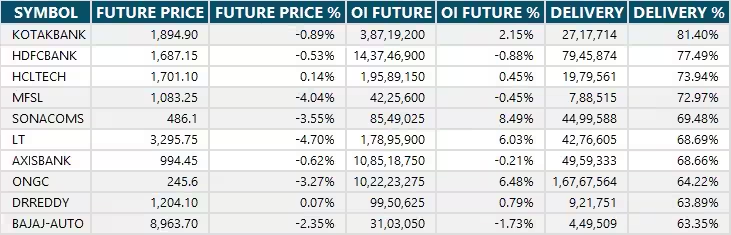
14) High Delivery Trades
Here are the stocks that saw a high share of delivery trades. A high share of delivery reflects investing (as opposed to trading) interest in a stock.
15) Stocks Under F&O Ban
Securities banned under the F&O segment include companies where derivative contracts cross 95 percent of the market-wide position limit.
Stocks added to F&O ban: Nil
Stocks retained in F&O ban: Nil
Stocks removed from F&O ban: Nil


0 Comment