31 Jan , 2025 By : Debdeep Gupta

The market continued its upward journey with a higher highs-higher lows formation for the third consecutive session, closing four-tenths of a percent higher with above-average volumes on January 30, the expiry day for monthly F&O contracts. The index tested the 20-day EMA and the mid-line of the Bollinger bands, which is at 23,300. Closing decisively above this level is expected to play a crucial role in further upward movement toward 23,400 (50-week EMA), followed by 23,600. However, as long as the index trades below this level, consolidation can't be ruled out, with 23,000 acting as support, given the elevated VIX, experts said.
Here are 15 data points we have collated to help you spot profitable trades:
1) Key Levels For The Nifty 50 (23,250)
Resistance based on pivot points: 23,307, 23,350, and 23,420
Support based on pivot points: 23,167, 23,124, and 23,054
Special Formation: The Nifty 50 formed a bullish candle for another session, especially after the Doji pattern formation on Tuesday, indicating that the market may be gaining strength ahead of the Union Budget to be presented on Saturday. The momentum indicators also showed a positive crossover, but the RSI (Relative Strength Index) at 45.9 remains in the lower band, and the MACD (Moving Average Convergence Divergence) is still below the zero line on the daily charts. However, on the hourly charts, both indicators showed good strength.
2) Key Levels For The Bank Nifty (49,312)
Resistance based on pivot points: 49,407, 49,500, and 49,651
Support based on pivot points: 49,106, 49,013, and 48,862
Resistance based on Fibonacci retracement: 49,409, 50,374
Support based on Fibonacci retracement: 47,875, 46,078
Special Formation: The Bank Nifty also gained further momentum, especially since the gap-up opening on Tuesday, forming a bullish candle with a higher lows formation for the third straight session. The index closed above its short-term moving averages (10 and 20-day EMAs), rising 0.3 percent with above-average volumes. A lower high-lower low pattern will be negated if the index decisively crosses the 49,650 zone. On the weekly timeframe, the index formed a robust bullish candlestick pattern with a 2 percent rally, signaling a positive trend.
3) Nifty Call Options Data
According to the weekly options data, the maximum Call open interest was seen at the 24,000 strike (with 32.45 lakh contracts). This level can act as a key resistance for the Nifty in the short term. It was followed by the 23,200 strike (24.53 lakh contracts) and the 23,500 strike (22.8 lakh contracts).
Maximum Call writing was observed at the 24,000 strike, which saw an addition of 13.17 lakh contracts, followed by the 23,300 and 23,200 strikes, which added 11.34 lakh and 8.66 lakh contracts, respectively. The maximum Call unwinding was seen at the 23,100 strike which shed 47,700 contracts, followed by the 22,950 and 22,550 strikes which shed 31,050 and 5,175 contracts, respectively.
4) Nifty Put Options Data
On the Put side, the 23,000 strike holds the maximum Put open interest (with 30.8 lakh contracts), which can act as a key support level for the Nifty. It was followed by the 23,200 strike (25.56 lakh contracts) and the 22,000 strike (21.94 lakh contracts).
The maximum Put writing was placed at the 23,200 strike, which saw an addition of 13.22 lakh contracts, followed by the 23,300 and 22,500 strikes, which added 10.45 lakh and 10.27 lakh contracts, respectively. There was hardly any Put unwinding seen in the 22,000-24,400 strike band.
5) Bank Nifty Call Options Data
According to the monthly options data, the maximum Call open interest was seen at the 49,000 strike, with 7.02 lakh contracts. This can act as a key level for the index in the short term. It was followed by the 51,000 strike (6.37 lakh contracts) and the 50,000 strike (5.99 lakh contracts).
Maximum Call writing was visible at the 50,000 strike (with the addition of 2.05 lakh contracts), followed by the 49,000 strike (1.5 lakh contracts) and the 49,500 strike (1.37 lakh contracts). There was hardly any Call unwinding seen in the 47,200-51,400 strike band.
6) Bank Nifty Put Options Data
On the Put side, the 49,000 strike holds the maximum Put open interest (with 9.38 lakh contracts), which can act as a key support level for the index. This was followed by the 48,000 strike (5.02 lakh contracts) and the 50,000 strike (4.9 lakh contracts).
The maximum Put writing was observed at the 49,000 strike (which added 2.66 lakh contracts), followed by the 49,500 strike (1.65 lakh contracts) and the 50,000 strike (1.58 lakh contracts). There was hardly any Put unwinding seen in the 47,200-51,400 strike band.
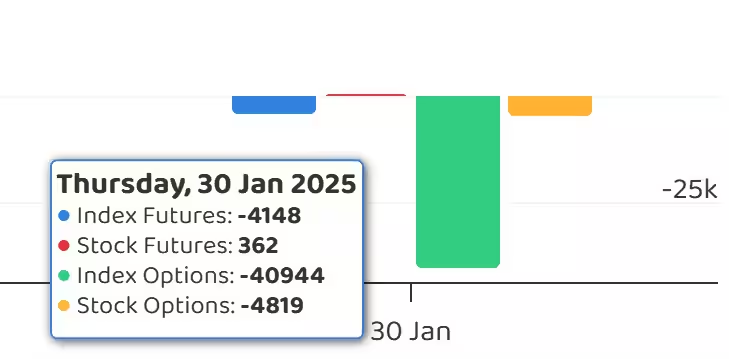
7) Funds Flow (Rs crore)
8) Put-Call Ratio
The Nifty Put-Call ratio (PCR), which indicates the mood of the market, fell to 0.97 on January 30, from the 1.06 level in the previous session.
The increasing PCR, or being higher than 0.7 or surpassing 1, means traders are selling more Put options than Call options, which generally indicates the firming up of a bullish sentiment in the market. If the ratio falls below 0.7 or moves towards 0.5, then it indicates selling in Calls is higher than selling in Puts, reflecting a bearish mood in the market.
9) India VIX
India VIX, the volatility index that measures expected market volatility, fell for the first time in the last five consecutive sessions, down by 6.71 percent to 17.39, but remained in the higher zone and above key moving averages, indicating caution for bulls.
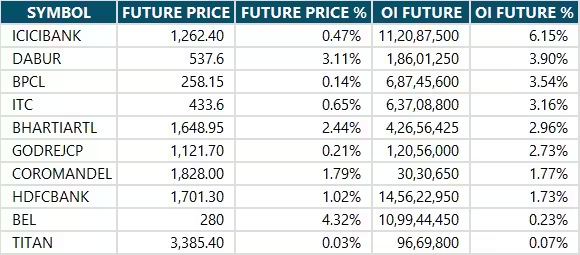
10) Long Build-up (11 Stocks)
A long build-up was seen in 11 stocks. An increase in open interest (OI) and price indicates a build-up of long positions.
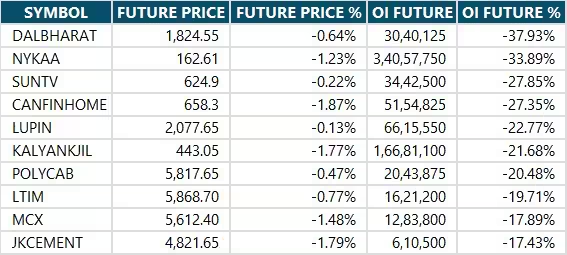
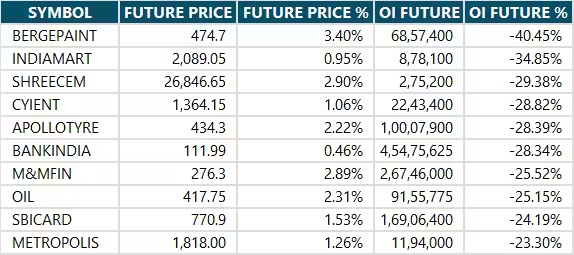
11) Long Unwinding (76 Stocks)
76 stocks saw a decline in open interest (OI) along with a fall in price, indicating long unwinding.
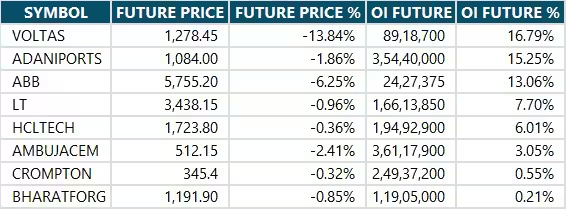
12) Short Build-up (8 Stocks)
8 stocks saw an increase in OI along with a fall in price, indicating a build-up of short positions.
13) Short-Covering (132 Stocks)
132 stocks saw short-covering, meaning a decrease in OI, along with a price increase.
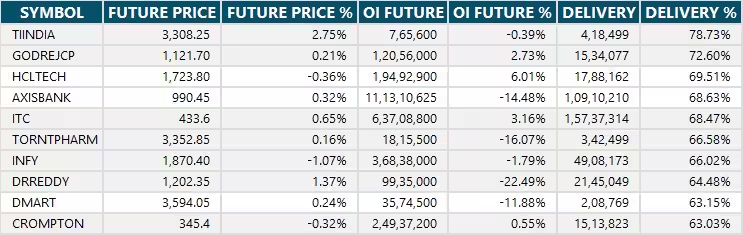
14) High Delivery Trades and High Rollovers
Here are the stocks that saw a high share of delivery trades. A high share of delivery reflects investing (as opposed to trading) interest in a stock.
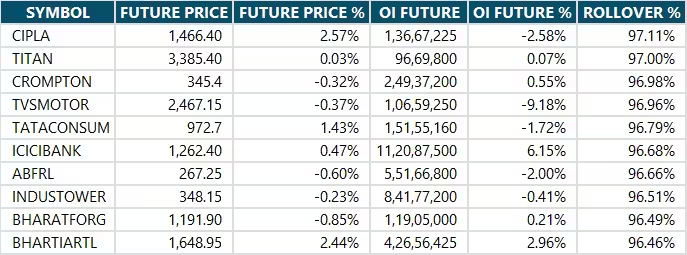
Here are the stocks which saw the highest rollovers on expiry day.
15) Stocks Under F&O Ban
Securities banned under the F&O segment include companies where derivative contracts cross 95 percent of the market-wide position limit.
Stocks added to F&O ban: Nil
Stocks retained in F&O ban: Nil
Stocks removed from F&O ban: Nil


0 Comment