30 Apr , 2025 By : Debdeep Gupta

The Nifty 50 witnessed consolidation and rangebound trading on April 29, closing on a flat note after recording a 1.2 percent rally in the previous session. The index maintained a higher highs–higher lows formation, and all moving averages trended upward alongside an expansion in Bollinger Bands, despite the elevated VIX. However, the attempt to break out failed due to profit booking. According to experts, as long as the index defends the 24,300 level on a closing basis, it is likely to move upward toward 24,550, followed by 24,860, which remains a crucial hurdle. On the downside, key support is placed in the 24,100–24,000 zone.
Here are 15 data points we have collated to help you spot profitable trades:
1) Key Levels For The Nifty 50 (24,336)
Resistance based on pivot points: 24,425, 24,465, and 24,528
Support based on pivot points: 24,298, 24,258, and 24,195
Special Formation: The Nifty 50 formed a small red candle with an upper shadow on the daily charts, indicating selling pressure at higher levels and a failed upside breakout attempt near the 24,350–24,400 resistance zone. Despite this, the overall trend remains strong, with the index trading well above all key moving averages, all of which are trending northward. The Bollinger Bands continued to expand, suggesting heightened volatility. The Relative Strength Index (RSI) remained above 60, closing at 65.05, and the MACD sustained a positive crossover, remaining well above the zero line, further reinforcing bullish momentum.
2) Key Levels For The Bank Nifty (55,391)
Resistance based on pivot points: 55,803, 55,967, and 56,233
Support based on pivot points: 55,271, 55,107, and 54,842
Resistance based on Fibonacci retracement: 56,307, 58,648
Support based on Fibonacci retracement: 54,117, 52,891
Special Formation: The Bank Nifty attempted to move toward its record high but failed to sustain those gains, forming a small bearish candlestick pattern with an upper shadow on the daily timeframe. This signaled selling pressure in the higher zone. The index closed down by 42 points. Despite the bearish candlestick, technical indicators remained strong. All exponential moving averages (EMAs) continued to trend upward, and the upper line of the Bollinger Bands expanded further, indicating a potential target near 57,000. The RSI stood at 70, and the MACD continued to move upward, reinforcing bullish undercurrents.
3) Nifty Call Options Data
According to the weekly options data, the 24,500 strike holds the maximum Call open interest (with 1.64 crore contracts). This level can act as a key resistance for the Nifty in the short term. It was followed by the 24,400 strike (1.5 crore contracts), and the 25,000 strike (1.19 crore contracts).
Maximum Call writing was observed at the 24,400 strike, which saw an addition of 93.5 lakh contracts, followed by the 24,500 and 24,350 strikes, which added 61.08 lakh and 51.3 lakh contracts, respectively. The maximum Call unwinding was seen at the 24,200 strike, which shed 5.5 lakh contracts, followed by 24,000 and 24,100 strikes, which shed 4.19 lakh and 2.87 lakh contracts, respectively.
4) Nifty Put Options Data
On the Put side, the maximum Put open interest was seen at the 24,300 strike (with 1.15 crore contracts), which can act as a key support level for the Nifty. It was followed by the 24,000 strike (1.1 crore contracts) and the 24,200 strike (91.58 lakh contracts).
The maximum Put writing was placed at the 24,300 strike, which saw an addition of 49.85 lakh contracts, followed by the 24,200 and 24,400 strikes, which added 15.18 lakh and 12.59 lakh contracts, respectively. The maximum Put unwinding was seen at the 23,500 strike, which shed 17.38 lakh contracts, followed by the 24,000 and 23,600 strikes, which shed 12.78 lakh and 8.09 lakh contracts, respectively.
5) Bank Nifty Call Options Data
According to the monthly options data, the 55,500 strike holds the maximum Call open interest, with 10.89 lakh contracts. This can act as a key resistance level for the index in the short term. It was followed by the 56,000 strike (8.34 lakh contracts) and the 57,000 strike (8.09 lakh contracts).
Maximum Call writing was visible at the 57,000 strike (with the addition of 1.71 lakh contracts), followed by the 56,000 strike (1.66 lakh contracts) and the 55,600 strike (97,290 contracts). The maximum Call unwinding was seen at the 55,000 strike, which shed 55,950 contracts, followed by the 56,700 and 57,100 strikes, which shed 15,600 and 14,910 contracts, respectively.
6) Bank Nifty Put Options Data
On the Put side, the maximum Put open interest was seen at the 54,000 strike (with 11.69 lakh contracts), which can act as a key support level for the index. This was followed by the 55,000 strike (8.99 lakh contracts) and the 55,500 strike (8.55 lakh contracts).
The maximum Put writing was observed at the 54,000 strike (which added 83,640 contracts), followed by the 56,000 strike (72,720 contracts) and the 55,800 strike (24,300 contracts). The maximum Put unwinding was seen at the 55,000 strike, which shed 43,020 contracts, followed by the 55,700 and 55,500 strikes, which shed 23,430 and 23,220 contracts, respectively.
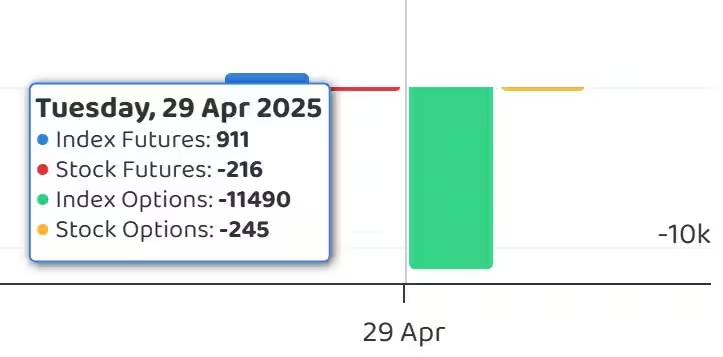
7) Funds Flow (Rs crore)
8) Put-Call Ratio
The Nifty Put-Call ratio (PCR), which indicates the mood of the market, dropped to 0.94 on April 29, from 1.22 in the previous session.
The increasing PCR, or being higher than 0.7 or surpassing 1, means traders are selling more Put options than Call options, which generally indicates the firming up of a bullish sentiment in the market. If the ratio falls below 0.7 or moves towards 0.5, then it indicates selling in Calls is higher than selling in Puts, reflecting a bearish mood in the market.
9) India VIX
The India VIX, the fear gauge, remained at elevated levels, signaling increased caution for bulls. It rose 2.54 percent to 17.37, staying above all key moving averages, indicating persistent market nervousness.
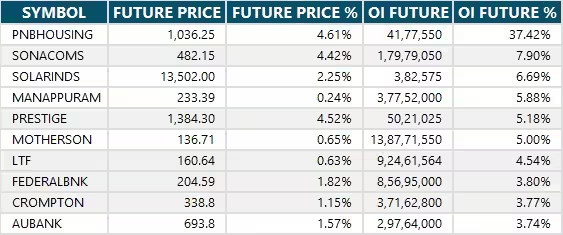
10) Long Build-up (50 Stocks)
A long build-up was seen in 50 stocks. An increase in open interest (OI) and price indicates a build-up of long positions.
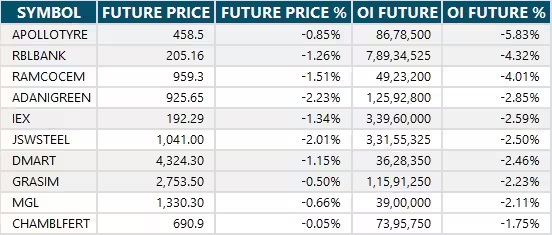
11) Long Unwinding (54 Stocks)
54 stocks saw a decline in open interest (OI) along with a fall in price, indicating long unwinding.
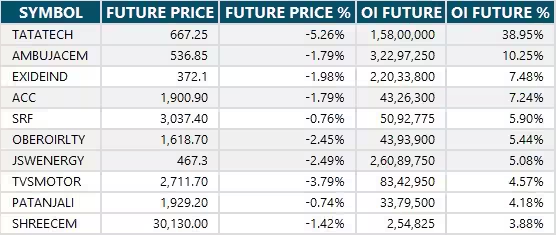
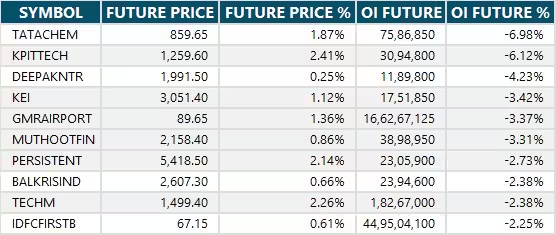
12) Short Build-up (77 Stocks)
77 stocks saw an increase in OI along with a fall in price, indicating a build-up of short positions.
13) Short-Covering (39 Stocks)
39 stocks saw short-covering, meaning a decrease in OI, along with a price increase.
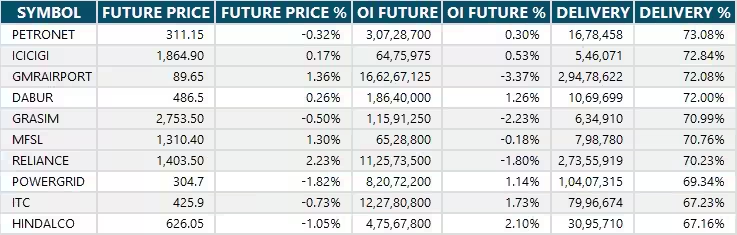
14) High Delivery Trades
Here are the stocks that saw a high share of delivery trades. A high share of delivery reflects investing (as opposed to trading) interest in a stock.
15) Stocks Under F&O Ban
Securities banned under the F&O segment include companies where derivative contracts cross 95 percent of the market-wide position limit.
Stocks added to F&O ban: Nil
Stocks retained in F&O ban: RBL Bank
Stocks removed from F&O ban: Nil


0 Comment