10 Feb , 2026 By : Debdeep Gupta

The Nifty 50 extended its upward journey by starting the week with a gap-up opening following the India–US interim trade agreement. The index rose 0.7 percent on February 9, supported by strong market breadth. Momentum indicators aligned with the rally, while the index sustained above all key moving averages. Hence, the benchmark index may rally toward the 26,000–26,200 levels in the upcoming sessions, provided it defends 25,780 (Monday’s low). Below this, 25,641 (the upper end of the bullish gap of February 3) will be the key support level to watch, experts said.
Here are 15 data points we have collated to help you spot profitable trades:
1) Key Levels For The Nifty 50 (25,867)
Resistance based on pivot points: 25,911, 25,944, and 25,998
Support based on pivot points: 25,803, 25,769, and 25,716
Special Formation: The Nifty formed a bearish candle with a lower shadow on the daily timeframe after a gap-up opening, indicating buying interest at lower levels despite minor profit booking at higher zones. The index sustained above all key moving averages, with short-term moving averages trending northward. The RSI climbed to 56.2 with a bullish crossover, while the MACD maintained its uptrend with a further increase in the histogram. All this indicates a continuation of positive momentum.
2) Key Levels For The Bank Nifty (60,669)
Resistance based on pivot points: 60,826, 60,916, and 61,061
Support based on pivot points: 60,535, 60,445, and 60,300
Resistance based on Fibonacci retracement: 61,148, 62,060
Support based on Fibonacci retracement: 60,000, 59,452
Special Formation: The Bank Nifty closed strong with nearly a one percent rally, reporting a bearish candle with a lower shadow on the daily charts after a strong gap-up opening, indicating consolidation near the upper Bollinger Bands. The index witnessed another strong gap-up trade in the current month. All key moving averages trended upward, while the momentum indicator RSI jumped above the 60 zone, and the MACD maintained a positive crossover with a further uptick in the histogram. All this indicates sustained bullish strength.
3) Nifty Call Options Data
According to the weekly options data, the 26,000 strike holds the maximum Call open interest (with 1.91 crore contracts). This level can act as a key resistance level for the Nifty in the short term. It was followed by the 25,900 strike (1.14 crore contracts) and 26,500 strike (90.69 lakh contracts).
Maximum Call writing was observed at the 26,000 strike, which saw an addition of 47.25 lakh contracts, followed by the 25,900 and 25,450 strikes, which added 47.13 lakh and 35.39 lakh contracts, respectively. The maximum Call unwinding was seen at the 25,700 strike which shed 67.35 lakh contracts, followed by the 25,600 and 25,750 strikes, which shed 40.41 lakh and 32.4 lakh contracts, respectively.
4) Nifty Put Options Data
On the Put side, the maximum Put open interest was seen at the 25,800 strike (with 1.38 crore contracts), which can act as a key support level for the Nifty in the short term. It was followed by the 25,500 strike (1.038 crore contracts) and the 25,700 strike (1.032 crore contracts).
The maximum Put writing was placed at the 25,800 strike, which saw an addition of 1.04 crore contracts, followed by the 25,850 and 25,750 strikes, which added 68.82 lakh and 53.92 lakh contracts, respectively. The maximum Put unwinding was seen at the 25,500 strike, which shed 16.25 lakh contracts, followed by the 25,600 and 25,200 strikes, which shed 16.01 lakh and 3.58 lakh contracts, respectively.
5) Bank Nifty Call Options Data
According to the monthly options data, the 60,000 strike holds the maximum Call open interest, with 15.29 lakh contracts. This can act as a key level for the index in the short term. It was followed by the 61,000 strike (6.95 lakh contracts) and the 60,500 strike (6.48 lakh contracts).
Maximum Call writing was observed at the 60,700 strike (with the addition of 2.76 lakh contracts), followed by the 60,600 strike (1.14 lakh contracts) and 60,800 strike (66,480 contracts). The maximum Call unwinding was seen at the 60,000 strike, which shed 1.44 lakh contracts, followed by the 60,200 and 60,100 strikes which shed 1.28 lakh and 1.15 lakh contracts, respectively.
6) Bank Nifty Put Options Data
On the Put side, the maximum Put open interest was seen at the 60,000 strike (with 19.84 lakh contracts), which can act as a key support level for the index. This was followed by the 59,000 strike (7.94 lakh contracts) and the 60,500 strike (5.3 lakh contracts).
The maximum Put writing was placed at the 60,700 strike (which added 2.86 lakh contracts), followed by the 60,500 strike (2.4 lakh contracts) and the 60,600 strike (1.35 lakh contracts). The maximum Put unwinding was seen at the 59,800 strike which shed 25,710 contracts, followed by the 59,900 and 60,100 strikes, which shed 19,530 and 9,090 contracts, respectively.
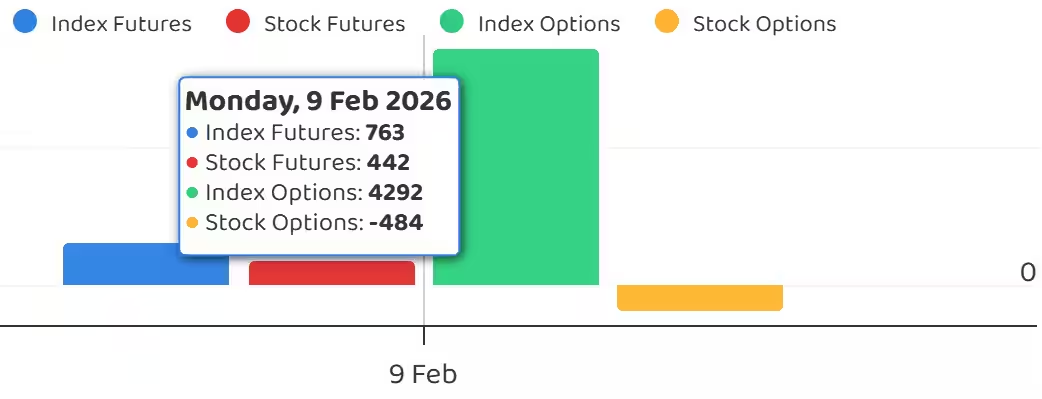
7) Funds Flow (Rs crore)
8) Put-Call Ratio
The Nifty Put-Call ratio (PCR), which indicates the mood of the market, climbed to 1.11 on February 9, compared to 0.96 in the previous session.
The increasing PCR, or being higher than 0.7 or surpassing 1, means traders are selling more Put options than Call options, which generally indicates the firming up of a bullish sentiment in the market. If the ratio falls below 0.7 or moves towards 0.5, then it indicates selling in Calls is higher than selling in Puts, reflecting a bearish mood in the market.
9) India VIX
India VIX, also known as the fear gauge, rebounded 2.09 percent to 12.19 after a five-day losing streak but remained below the 200-day EMA and short-term moving averages, signaling comfort for bulls. Any further fall below the 11 zone could bring major comfort for bulls.
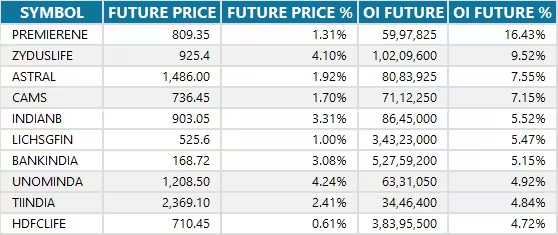
10) Long Build-up (108 Stocks)
A long build-up was seen in 108 stocks. An increase in open interest (OI) and price indicates a build-up of long positions.
11) Long Unwinding (9 Stocks)
9 stocks saw a decline in open interest (OI) along with a fall in price, indicating long unwinding.
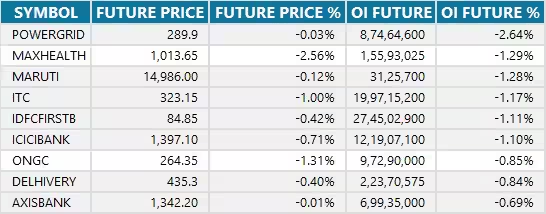
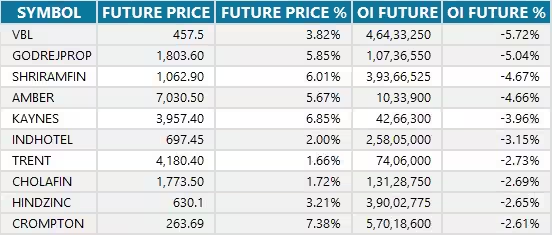
12) Short Build-up (20 Stocks)
20 stocks saw an increase in OI along with a fall in price, indicating a build-up of short positions.
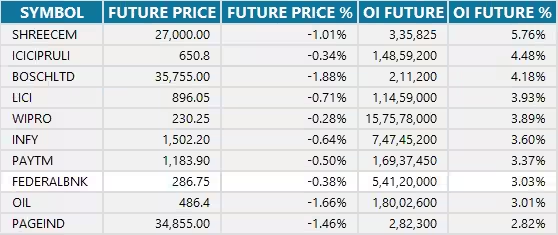
13) Short-Covering (75 Stocks)
75 stocks saw short-covering, meaning a decrease in OI, along with a price increase.
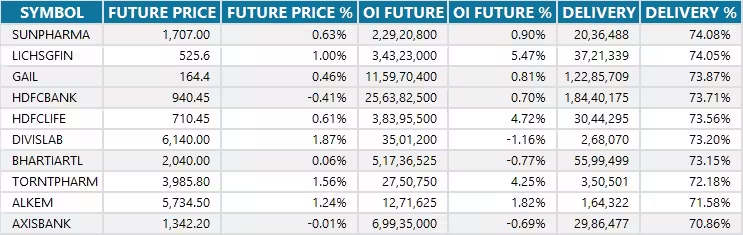
14) High Delivery Trades
Here are the stocks that saw a high share of delivery trades. A high share of delivery reflects investing (as opposed to trading) interest in a stock.
15) Stocks Under F&O Ban
Securities banned under the F&O segment include companies where derivative contracts cross 95 percent of the market-wide position limit.
Stocks added to F&O ban: SAIL
Stocks retained in F&O ban: Sammaan Capital
Stocks removed from F&O ban: Nil


0 Comment