01 Jul , 2025 By : Debdeep Gupta

The Nifty 50 slipped into the red for the first time in the last five consecutive sessions, declining by 0.5 percent on June 30 due to profit booking, following a 2 percent rally in the past week. Overall, the trend remains upward, although consolidation and range-bound trading may persist for a few more sessions before the market enters a fresh leg of the upmove, according to experts. As long as the index trades below 25,700, the consolidation may continue, with support at 25,400—below which the correction could extend to 25,200, a key support zone.
Here are 15 data points we have collated to help you spot profitable trades:
1) Key Levels For The Nifty 50 (25,517)
Resistance based on pivot points: 25,628, 25,674, and 25,749
Support based on pivot points: 25,478, 25,432, and 25,357
Special Formation: The Nifty 50 formed a bearish candle, resembling a Bearish Engulfing pattern at the swing high on the daily charts. A confirmation of a short-term trend reversal will be seen in the following session. The index still traded near the upper line of the Bollinger Bands, while the MACD maintained a positive crossover, with a healthy bias reflected in the histogram. The RSI, currently at 63.84, remained strong though it tilted slightly downward.
2) Key Levels For The Bank Nifty (57,313)
Resistance based on pivot points: 57,534, 57,634, and 57,794
Support based on pivot points: 57,213, 57,114, and 56,953
Resistance based on Fibonacci retracement: 57,566, 58,224
Support based on Fibonacci retracement: 57,032, 56,673
Special Formation: The Bank Nifty maintained its higher highs–higher lows formation and continued to trade near the upper Bollinger Bands, despite a mild correction of 0.23 percent. The index traded well above short-term moving averages, with a visible expansion in the Bollinger Bands. The MACD sustained a positive crossover, accompanied by a positive bias in the histogram. The Stochastic RSI also trended upward with a positive crossover, while the RSI, at 65.32, remained in a positive crossover but showed a slight downward tilt.
3) Nifty Call Options Data
According to the weekly options data, the maximum Call open interest was seen at the 26,000 strike (with 1.23 crore contracts). This level can act as a key resistance for the Nifty in the short term. It was followed by the 25,600 strike (1.02 crore contracts), and the 25,700 strike (91.69 lakh contracts).
Maximum Call writing was observed at the 25,600 strike, which saw an addition of 59.24 lakh contracts, followed by the 25,700 and 25,800 strikes, which added 49.18 lakh and 47.25 lakh contracts, respectively. The maximum Call unwinding was seen at the 25,300 strike, which shed 1.63 lakh contracts, followed by the 25,400 and 25,200 strikes, which shed 1.17 lakh and 1 lakh contracts, respectively.
4) Nifty Put Options Data
On the Put side, the 25,000 strike holds the maximum Put open interest (with 78.47 lakh contracts), which can act as a key support level for the Nifty. It was followed by the 25,500 strike (74.51 lakh contracts) and the 25,200 strike (64.14 lakh contracts).
The maximum Put writing was placed at the 24,900 strike, which saw an addition of 10.28 lakh contracts, followed by the 25,200 and 24,800 strikes, which added 6.42 lakh and 5.74 lakh contracts, respectively. The maximum Put unwinding was observed at the 25,600 strike, which shed 23.77 lakh contracts, followed by the 25,400 and 25,500 strikes, which shed 19.86 lakh and 13.17 lakh contracts, respectively.
5) Bank Nifty Call Options Data
According to the monthly options data, the 56,000 strike holds the maximum Call open interest, with 14.19 lakh contracts. This can act as a key level for the index in the short term. It was followed by the 58,000 strike (8.07 lakh contracts) and the 57,000 strike (7.67 lakh contracts).
Maximum Call writing was visible at the 57,500 strike (with the addition of 1.76 lakh contracts), followed by the 58,000 strike (1.41 lakh contracts), and the 57,400 strike (73,220 contracts). The maximum Call unwinding was seen at the 57,000 strike, which shed 17,920 contracts, followed by the 57,200 and 56,500 strikes, which shed 16,555 and 13,265 contracts, respectively.
6) Bank Nifty Put Options Data
On the Put side, the maximum Put open interest was seen at the 56,000 strike (with 20.41 lakh contracts), which can act as a key support level for the index. This was followed by the 57,000 strike (11.22 lakh contracts) and the 56,500 strike (5.28 lakh contracts).
The maximum Put writing was observed at the 57,500 strike (which added 72,940 contracts), followed by the 56,000 strike (47,950 contracts) and the 56,400 strike (36,610 contracts). The maximum Put unwinding was seen at the 57,200 strike, which shed 36,505 contracts, followed by the 57,100 and 56,700 strikes, which shed 12,285 and 7,770 contracts, respectively.
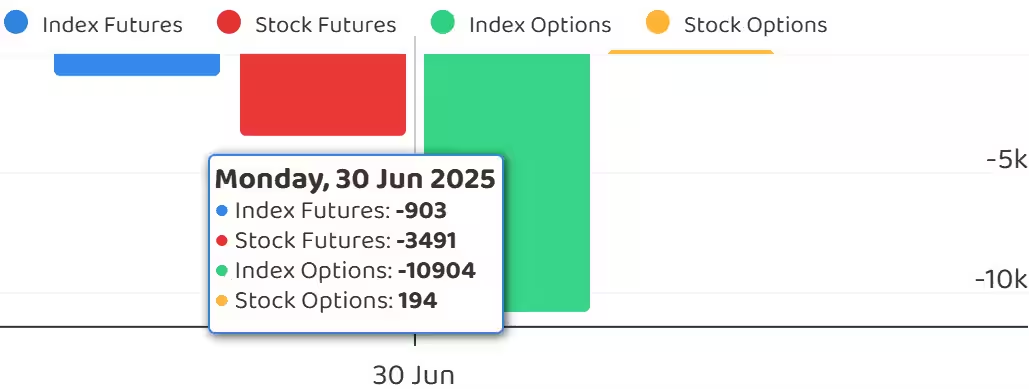
7) Funds Flow (Rs crore)
8) Put-Call Ratio
The Nifty Put-Call ratio (PCR), which indicates the mood of the market, dropped sharply to 0.81 on June 30, compared to 1.25 in the previous session.
The increasing PCR, or being higher than 0.7 or surpassing 1, means traders are selling more Put options than Call options, which generally indicates the firming up of a bullish sentiment in the market. If the ratio falls below 0.7 or moves towards 0.5, then it indicates selling in Calls is higher than selling in Puts, reflecting a bearish mood in the market.
9) India VIX
The India VIX, which measures expected market volatility, remained supportive of the bulls, although it rebounded after four consecutive days of decline. The VIX rose by 3.21 percent, reaching 12.79 levels.
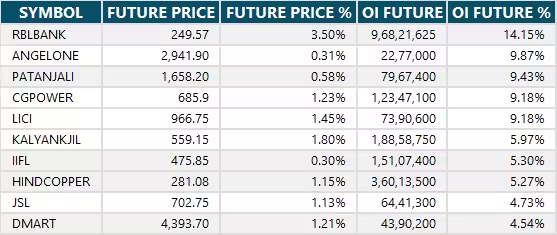
10) Long Build-up (82 Stocks)
A long build-up was seen in 82 stocks. An increase in open interest (OI) and price indicates a build-up of long positions.
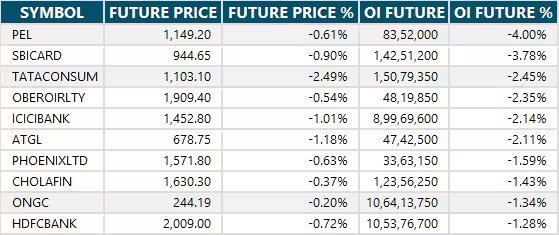
11) Long Unwinding (25 Stocks)
25 stocks saw a decline in open interest (OI) along with a fall in price, indicating long unwinding.
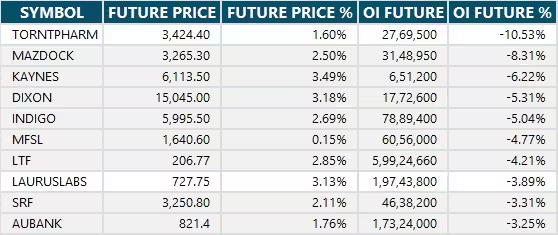
12) Short Build-up (76 Stocks)
76 stocks saw an increase in OI along with a fall in price, indicating a build-up of short positions.

13) Short-Covering (44 Stocks)
44 stocks saw short-covering, meaning a decrease in OI, along with a price increase.
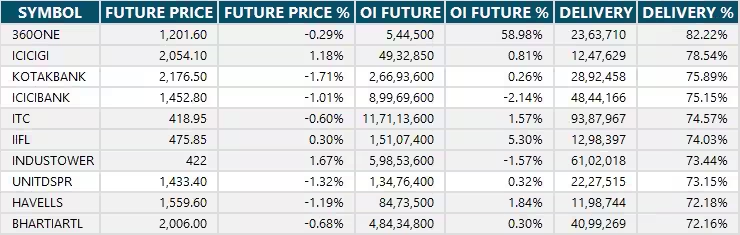
14) High Delivery Trades
Here are the stocks that saw a high share of delivery trades. A high share of delivery reflects investing (as opposed to trading) interest in a stock.
15) Stocks Under F&O Ban
Securities banned under the F&O segment include companies where derivative contracts cross 95 percent of the market-wide position limit.
Stocks added to F&O ban: RBL Bank
Stocks retained in F&O ban: Nil
Stocks removed from F&O ban: Nil


0 Comment