24 Apr , 2025 By : Debdeep Gupta

The Nifty 50 closed 0.7 percent higher on April 23 ahead of monthly F&O expiry scheduled on April 24, extending its upward move for the seventh straight session, with the formation of a bearish reversal pattern at the highs. If the pattern gets confirmed in the following session, bulls need to be cautious, as some profit booking or consolidation can't be ruled out, with key support at 24,000, where the maximum Put open interest is placed. However, if the rally continues, 24,500–24,550 is expected to be a key hurdle in the upcoming sessions, according to experts. Overall, the trend remains positive.
Here are 15 data points we have collated to help you spot profitable trades:
1) Key Levels For The Nifty 50 (24,329)
Resistance based on pivot points: 24,361, 24,417, and 24,509
Support based on pivot points: 24,178, 24,121, and 24,030
Special Formation: The Nifty 50 formed a small bearish candle with a long lower shadow, resembling a Hanging Man-type pattern on the daily charts, which is a bearish reversal pattern. However, the higher tops–higher bottoms formation has sustained for seven consecutive sessions, and the index traded near the upper line of the Bollinger Bands. The momentum indicators — RSI (Relative Strength Index) at 67.7 percent — maintained its upward move, and MACD (Moving Average Convergence Divergence) stayed well above the zero line with a positive crossover and a healthy histogram.
2) Key Levels For The Bank Nifty (55,370)
Resistance based on pivot points: 55,901, 56,122, and 56,480
Support based on pivot points: 55,186, 54,965, and 54,608
Resistance based on Fibonacci retracement: 56,307, 58,648
Support based on Fibonacci retracement: 54,459, 53,446
Special Formation: The Bank Nifty formed a long bearish candlestick pattern with a minor lower shadow, resembling a Bearish Belt Hold-like pattern on the daily charts at higher levels, following a Shooting Star-type pattern in the previous session, signalling caution for bulls. The fall of half a percent was warranted after a nearly 7,000-point rally since the low of April 7. However, overall, the trend remains strong, with the index trading above all key moving averages. Short- and medium-term moving averages have crossed above long-term moving averages. MACD is still positive, but the histogram suggested that momentum seems to be fading, while the RSI at 73.89 was also healthy but tilted downward.
3) Nifty Call Options Data
According to the monthly options data, the 25,000 strike holds the maximum Call open interest (with 1.25 crore contracts). This level can act as a key resistance for the Nifty in the short term. It was followed by the 24,300 strike (1.06 crore contracts), and the 24,500 strike (1.01 crore contracts).
Maximum Call writing was observed at the 24,300 strike, which saw an addition of 41.48 lakh contracts, followed by the 25,100 and 25,200 strikes, which added 37.24 lakh and 34.92 lakh contracts, respectively. The maximum Call unwinding was seen at the 24,200 strike, which shed 29.1 lakh contracts, followed by 24,150 and 24,100 strikes, which shed 17.04 lakh and 14.43 lakh contracts, respectively.
4) Nifty Put Options Data
On the Put side, the maximum Put open interest was seen at the 24,000 strike (with 1.32 crore contracts), which can act as a key support level for the Nifty. It was followed by the 24,200 strike (1.1 crore contracts) and the 23,500 strike (1.08 crore contracts).
The maximum Put writing was placed at the 24,200 strike, which saw an addition of 60.06 lakh contracts, followed by the 24,300 and 24,250 strikes, which added 46.88 lakh and 35.63 lakh contracts, respectively. The maximum Put unwinding was seen at the 23,900 strike, which shed 14.04 lakh contracts, followed by the 23,800 and 23,850 strikes, which shed 12.31 lakh and 2.27 lakh contracts, respectively.
5) Bank Nifty Call Options Data
According to the monthly options data, the 56,000 strike holds the maximum Call open interest, with 32.9 lakh contracts. This can act as a key resistance level for the index in the short term. It was followed by the 57,000 strike (21.63 lakh contracts) and the 56,500 strike (18.6 lakh contracts).
Maximum Call writing was visible at the 56,500 strike (with the addition of 9.15 lakh contracts), followed by the 56,000 strike (7.67 lakh contracts) and the 55,400 strike (7.18 lakh contracts). The maximum Call unwinding was seen at the 55,000 strike, which shed 1.74 lakh contracts, followed by the 54,000 and 54,500 strikes, which shed 94,920 and 67,680 contracts, respectively.
6) Bank Nifty Put Options Data
On the Put side, the maximum Put open interest was seen at the 55,000 strike (with 28.3 lakh contracts), which can act as a key support level for the index. This was followed by the 53,500 strike (23.1 lakh contracts) and the 54,000 strike (21.35 lakh contracts).
The maximum Put writing was observed at the 55,300 strike (which added 7.75 lakh contracts), followed by the 54,000 strike (6.15 lakh contracts) and the 53,900 strike (5.23 lakh contracts). The maximum Put unwinding was seen at the 55,600 strike, which shed 1.15 lakh contracts, followed by the 55,700 and 54,500 strikes, which shed 72,270 and 49,620 contracts, respectively.
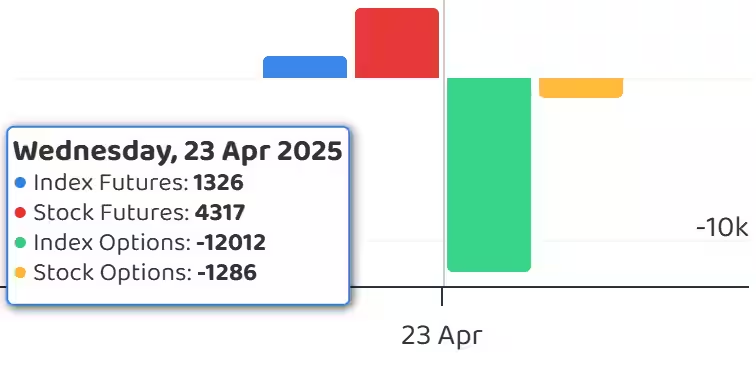
7) Funds Flow (Rs crore)
8) Put-Call Ratio
The Nifty Put-Call ratio (PCR), which indicates the mood of the market, was unchanged at 1.1 on April 23, compared to the previous session.
The increasing PCR, or being higher than 0.7 or surpassing 1, means traders are selling more Put options than Call options, which generally indicates the firming up of a bullish sentiment in the market. If the ratio falls below 0.7 or moves towards 0.5, then it indicates selling in Calls is higher than selling in Puts, reflecting a bearish mood in the market.
9) India VIX
The India VIX, the fear gauge, rebounded by 4.79 percent to move closer to the 16 mark, at 15.96 levels, signalling bulls to remain cautious. This was a significant upward move after a consistent downtrend since April 11.
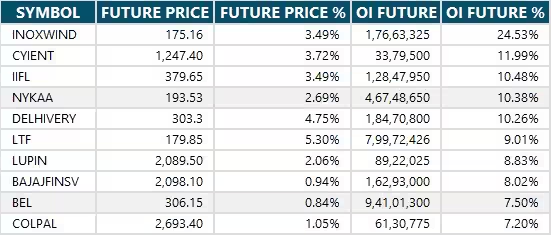
10) Long Build-up (68 Stocks)
A long build-up was seen in 68 stocks. An increase in open interest (OI) and price indicates a build-up of long positions.
11) Long Unwinding (31 Stocks)
31 stocks saw a decline in open interest (OI) along with a fall in price, indicating long unwinding.
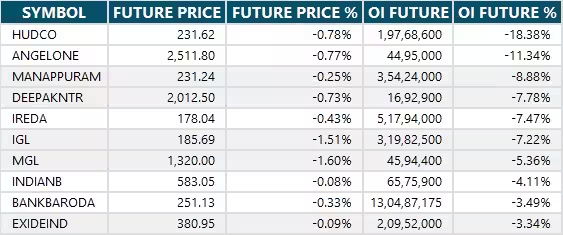
12) Short Build-up (35 Stocks)
35 stocks saw an increase in OI along with a fall in price, indicating a build-up of short positions.
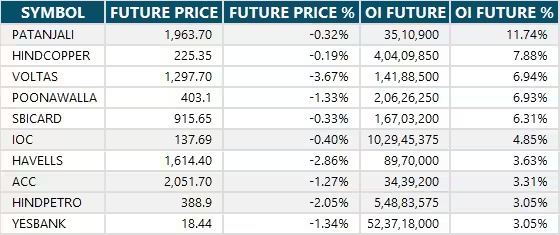
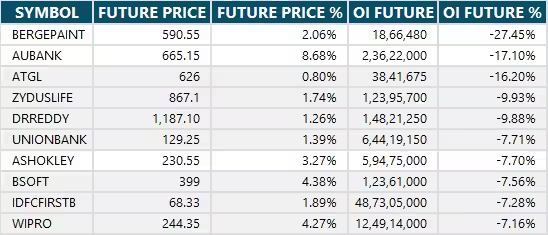
13) Short-Covering (88 Stocks)
88 stocks saw short-covering, meaning a decrease in OI, along with a price increase.
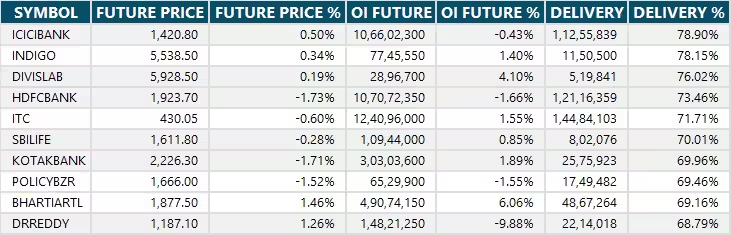
14) High Delivery Trades
Here are the stocks that saw a high share of delivery trades. A high share of delivery reflects investing (as opposed to trading) interest in a stock.
15) Stocks Under F&O Ban
Securities banned under the F&O segment include companies where derivative contracts cross 95 percent of the market-wide position limit.
Stocks added to F&O ban: Nil
Stocks retained in F&O ban: RBL Bank
Stocks removed from F&O ban: Manappuram Finance


0 Comment