22 Apr , 2025 By : Debdeep Gupta

The Nifty 50 clocked a gain of more than 1 percent on April 21, making a healthy start to the monthly F&O expiry week and extending its upward journey for the fifth straight session. The decisive move above the 24,000 mark—also the 50% Fibonacci retracement level from the September 2024 high to the April 2025 low—along with positive momentum indicators, signals a healthy trend ahead. However, with the index now touching the upper line of the Bollinger Bands, some consolidation cannot be ruled out. According to experts, the index may find support at 24,000, followed by 23,900 as a key support zone in case of consolidation. In the short term, 24,550 is expected to act as a key resistance zone.
Here are 15 data points we have collated to help you spot profitable trades:
1) Key Levels For The Nifty 50 (24,126)
Resistance based on pivot points: 24,182, 24,250, and 24,359
Support based on pivot points: 23,964, 23,896, and 23,787
Special Formation: The Nifty 50 formed a bullish candlestick pattern on the daily charts with above-average volumes and continued its higher highs–higher lows formation for the fifth consecutive session. The index reached the upper line of the Bollinger Bands, while all key moving averages—the 5, 10, 20, and 50-day EMAs—trended upward. Momentum indicators, including the Relative Strength Index (RSI) at 65.53 and the Moving Average Convergence Divergence (MACD), maintained a positive crossover, reinforcing the bullish outlook.
2) Key Levels For The Bank Nifty (55,305)
Resistance based on pivot points: 55,448, 55,633, and 55,934
Support based on pivot points: 54,846, 54,661, and 54,360
Resistance based on Fibonacci retracement: 56,307, 58,648
Support based on Fibonacci retracement: 53,631, 52,498
Special Formation: The Bank Nifty continued to outperform the benchmark Nifty 50, hitting a fresh record high by surpassing the 55,000 mark for the first time. It rose 1.87 percent following a gap-up opening, supported by above-average volumes. The index formed a bullish candle and maintained its higher highs–higher lows formation for the fifth straight session. It traded well above the upper line of the Bollinger Bands, while the RSI stood at a strong 75.51 and the MACD remained above the zero line, sustaining a strong positive crossover.
3) Nifty Call Options Data
According to the monthly options data, the 25,000 strike holds the maximum Call open interest (with 1.07 crore contracts). This level can act as a key resistance for the Nifty in the short term. It was followed by the 24,500 strike (83.64 lakh contracts), and the 24,200 strike (75.16 lakh contracts).
Maximum Call writing was observed at the 24,200 strike, which saw an addition of 48.52 lakh contracts, followed by the 24,300 and 24,150 strikes, which added 37.78 lakh and 30.77 lakh contracts, respectively. The maximum Call unwinding was seen at the 23,500 strike, which shed 7.84 lakh contracts, followed by 23,700 and 23,800 strikes, which shed 7.47 lakh and 5.95 lakh contracts, respectively.
4) Nifty Put Options Data
On the Put side, the maximum Put open interest was seen at the 24,000 strike (with 89.2 lakh contracts), which can act as a key support level for the Nifty. It was followed by the 23,500 strike (88.33 lakh contracts) and the 23,400 strike (66.98 lakh contracts).
The maximum Put writing was placed at the 24,000 strike, which saw an addition of 68.71 lakh contracts, followed by the 24,100 and 23,900 strikes, which added 50.04 lakh and 37.57 lakh contracts, respectively. The maximum Put unwinding was seen at the 25,000 strike, which shed 2.25 lakh contracts, followed by the 24,700 and 24,850 strikes, which shed 4,200 and 375 contracts, respectively.
5) Bank Nifty Call Options Data
According to the monthly options data, the 56,000 strike holds the maximum Call open interest, with 19.13 lakh contracts. This can act as a key resistance level for the index in the short term. It was followed by the 55,500 strike (14.44 lakh contracts) and the 55,000 strike (14.11 lakh contracts).
Maximum Call writing was visible at the 56,000 strike (with the addition of 9.39 lakh contracts), followed by the 55,400 strike (6.6 lakh contracts) and the 55,500 strike (6.26 lakh contracts). The maximum Call unwinding was seen at the 54,000 strike, which shed 3.49 lakh contracts, followed by the 55,000 and 54,500 strikes, which shed 3.44 lakh and 3.28 lakh contracts, respectively.
6) Bank Nifty Put Options Data
On the Put side, the maximum Put open interest was seen at the 55,000 strike (with 18.68 lakh contracts), which can act as a key support level for the index. This was followed by the 54,000 strike (13.35 lakh contracts) and the 54,500 strike (11.31 lakh contracts).
The maximum Put writing was observed at the 55,000 strike (which added 17.59 lakh contracts), followed by the 54,500 strike (9.79 lakh contracts) and the 55,200 strike (8.13 lakh contracts). The maximum Put unwinding was seen at the 53,300 strike, which shed 25,860 contracts, followed by the 53,700 and 53,400 strikes, which shed 14,220 and 13,500 contracts, respectively.
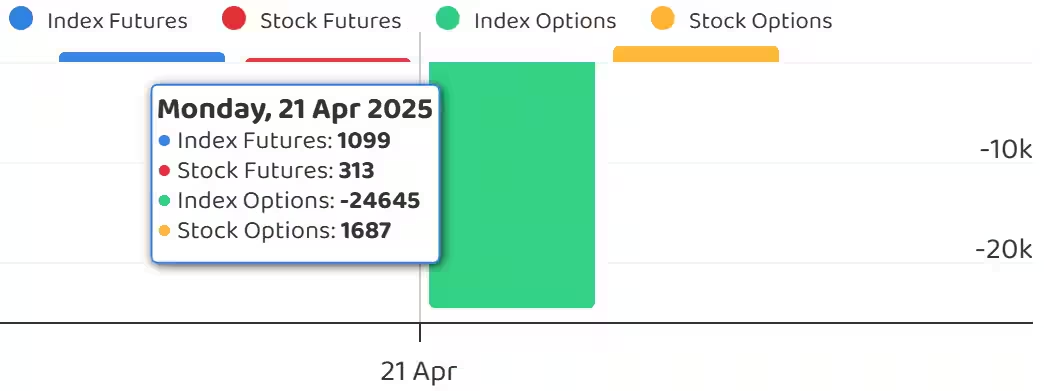
7) Funds Flow (Rs crore)
8) Put-Call Ratio
The Nifty Put-Call ratio (PCR), which indicates the mood of the market, fell to 1.15 on April 21, against 1.17 in the previous session.
The increasing PCR, or being higher than 0.7 or surpassing 1, means traders are selling more Put options than Call options, which generally indicates the firming up of a bullish sentiment in the market. If the ratio falls below 0.7 or moves towards 0.5, then it indicates selling in Calls is higher than selling in Puts, reflecting a bearish mood in the market.
9) India VIX
The India VIX, often referred to as the market’s fear gauge, remained supportive of the bullish trend as long as it trades below the 16 mark. It inched up by 0.31 percent to 15.52 after a four-day decline.
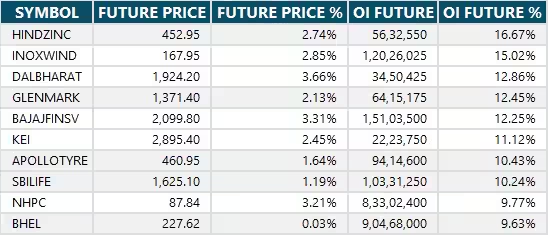
10) Long Build-up (120 Stocks)
A long build-up was seen in 120 stocks. An increase in open interest (OI) and price indicates a build-up of long positions.
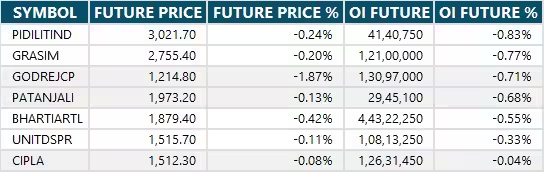
11) Long Unwinding (7 Stocks)
7 stocks saw a decline in open interest (OI) along with a fall in price, indicating long unwinding.
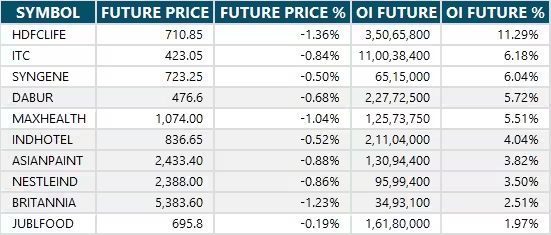
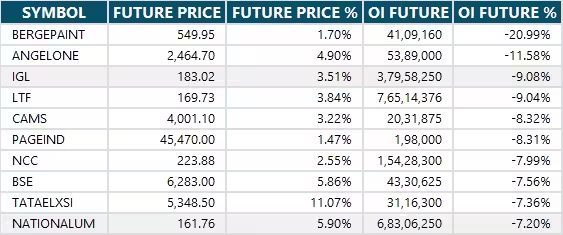
12) Short Build-up (18 Stocks)
18 stocks saw an increase in OI along with a fall in price, indicating a build-up of short positions.
13) Short-Covering (77 Stocks)
77 stocks saw short-covering, meaning a decrease in OI, along with a price increase.
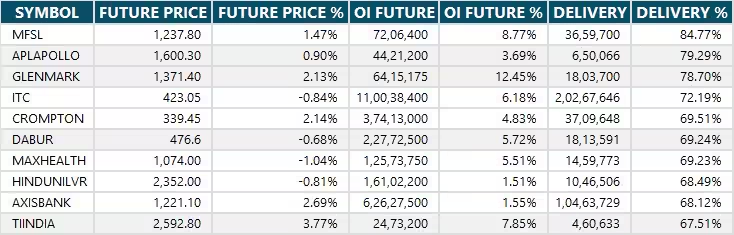
14) High Delivery Trades
Here are the stocks that saw a high share of delivery trades. A high share of delivery reflects investing (as opposed to trading) interest in a stock.
15) Stocks Under F&O Ban
Securities banned under the F&O segment include companies where derivative contracts cross 95 percent of the market-wide position limit.
Stocks added to F&O ban: Tata Elxsi
Stocks retained in F&O ban: Angel One, Hindustan Copper, IREDA, Manappuram Finance,
Stocks removed from F&O ban: National Aluminium Company


0 Comment