17 Apr , 2025 By : Debdeep Gupta

The last-hour gains helped the Nifty 50 extend its upward trend for the third straight session on April 16, closing 0.5 percent higher ahead of the weekly F&O expiry on April 17. The index surpassed the 200-day EMA and the 78.6% Fibonacci retracement level (from the March high to the April low), with a positive bias in momentum indicators and oscillators, signaling further upside potential. According to experts, if the index sustains above the 200-day EMA (23,360), the next target zone would be 23,550–23,650. Above this, the 23,900 level will be the one to watch. In case of consolidation, on the downside, 23,200 is likely to act as a key support level, aligning with the upper band of the bullish gap formed on April 15.
Here are 15 data points we have collated to help you spot profitable trades:
1) Key Levels For The Nifty 50 (23,437)
Resistance based on pivot points: 23,456, 23,498, and 23,567
Support based on pivot points: 23,319, 23,277, and 23,208
Special Formation: The Nifty 50 formed a bullish candlestick pattern with a minor lower shadow on the daily chart, sustaining a higher high–higher low structure for the third consecutive day. The index closed above the 200-day EMA and the 78.6% Fibonacci retracement, while the 5-day EMA crossed above the 10, 20, and 50-day EMAs, indicating a positive trend. Furthermore, the momentum indicator RSI (Relative Strength Index) trended upward at 57.44, and the MACD gave a positive crossover above the zero line—both reinforcing the bullish setup.
2) Key Levels For The Bank Nifty (53,118)
Resistance based on pivot points: 53,183, 53,346, and 53,611
Support based on pivot points: 52,653, 52,490, and 52,225
Resistance based on Fibonacci retracement: 54,467, 56,307
Support based on Fibonacci retracement: 51,875, 51,078
Special Formation: The Bank Nifty outperformed the benchmark Nifty 50, rising 1.41 percent and closing at the upper line of the Bollinger Bands, accompanied by above-average volumes. The index also saw a long trendline breakout and a golden crossover, with the 50-day EMA crossing above the 200-day EMA—both suggesting a bullish bias. Additionally, the RSI stood strong at 67.69, and the MACD remained in a positive crossover.
3) Nifty Call Options Data
According to the weekly options data, the 24,000 strike holds the maximum Call open interest (with 1.1 crore contracts). This level can act as a key resistance for the Nifty in the short term. It was followed by the 23,500 strike (81.41 lakh contracts), and the 23,800 strike (69.98 lakh contracts).
Maximum Call writing was observed at the 23,450 strike, which saw an addition of 21.53 lakh contracts, followed by the 24,300 and 23,900 strikes, which added 14.05 lakh and 13.93 lakh contracts, respectively. The maximum Call unwinding was seen at the 23,300 strike, which shed 33.52 lakh contracts, followed by 23,350 and 23,500 strikes, which shed 16.28 lakh and 14.13 lakh contracts, respectively.
4) Nifty Put Options Data
On the Put side, the maximum Put open interest was observed at the 23,000 strike (with 94.06 lakh contracts), which can act as a key support level for the Nifty. It was followed by the 23,300 strike (85.54 lakh contracts) and the 22,500 strike (75.95 lakh contracts).
The maximum Put writing was placed at the 23,400 strike, which saw an addition of 25.75 lakh contracts, followed by the 22,600 and 22,900 strikes, which added 11.78 lakh and 10.91 lakh contracts, respectively. The maximum Put unwinding was seen at the 23,300 strike, which shed 11.5 lakh contracts, followed by the 22,550 and 23,100 strikes, which shed 3.87 lakh and 2.12 lakh contracts, respectively.
5) Bank Nifty Call Options Data
According to the monthly options data, the maximum Call open interest was seen at the 55,000 strike, with 14.82 lakh contracts. This can act as a key resistance level for the index in the short term. It was followed by the 53,000 strike (14.33 lakh contracts) and the 54,000 strike (12.53 lakh contracts).
Maximum Call writing was visible at the 53,100 strike (with the addition of 1.86 lakh contracts), followed by the 52,800 strike (1.75 lakh contracts) and the 55,000 strike (1.16 lakh contracts). The maximum Call unwinding was seen at the 52,500 strike, which shed 2.82 lakh contracts, followed by the 54,000 and 52,400 strikes, which shed 1.9 lakh and 1.4 lakh contracts, respectively.
6) Bank Nifty Put Options Data
On the Put side, the 51,000 strike holds the maximum Put open interest (with 13.39 lakh contracts), which can act as a key support level for the index. This was followed by the 52,000 strike (12.77 lakh contracts) and the 53,000 strike (10.3 lakh contracts).
The maximum Put writing was observed at the 53,000 strike (which added 6.02 lakh contracts), followed by the 52,500 strike (4 lakh contracts) and the 52,000 strike (2.68 lakh contracts). The maximum Put unwinding was seen at the 51,200 strike, which shed 1.32 lakh contracts, followed by the 52,100 and 52,300 strikes, which shed 59,640 and 33,270 contracts, respectively.
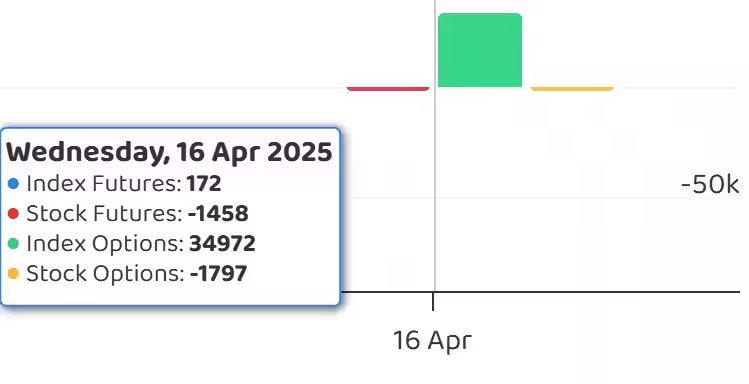
7) Funds Flow (Rs crore)
8) Put-Call Ratio
The Nifty Put-Call ratio (PCR), which indicates the mood of the market, rose to 0.98 on April 16, against 0.93 in the previous session.
The increasing PCR, or being higher than 0.7 or surpassing 1, means traders are selling more Put options than Call options, which generally indicates the firming up of a bullish sentiment in the market. If the ratio falls below 0.7 or moves towards 0.5, then it indicates selling in Calls is higher than selling in Puts, reflecting a bearish mood in the market.
9) India VIX
The India VIX, often referred to as the "fear factor," declined for the third consecutive day, down by 1.61 percent to 15.87 levels—bringing the bulls into a more comfortable zone. The VIX has plunged 31.57 percent from last week's high.
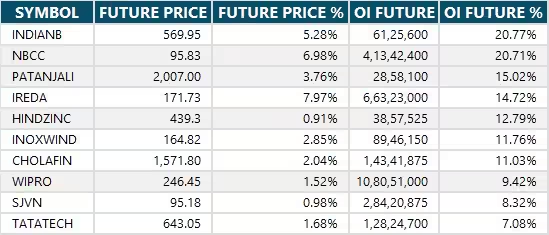
10) Long Build-up (95 Stocks)
A long build-up was seen in 95 stocks. An increase in open interest (OI) and price indicates a build-up of long positions.
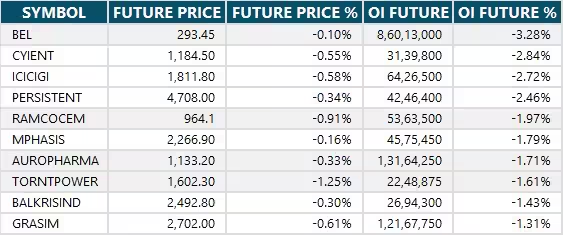
11) Long Unwinding (26 Stocks)
26 stocks saw a decline in open interest (OI) along with a fall in price, indicating long unwinding.
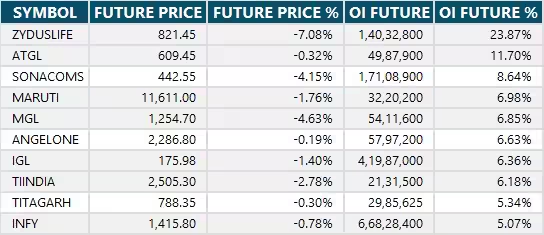
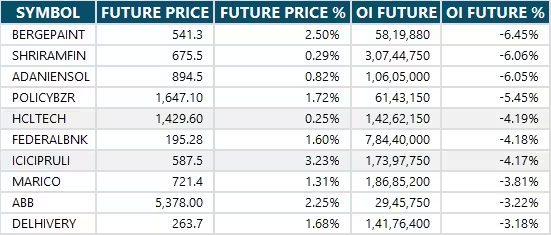
12) Short Build-up (47 Stocks)
47 stocks saw an increase in OI along with a fall in price, indicating a build-up of short positions.
13) Short-Covering (53 Stocks)
53 stocks saw short-covering, meaning a decrease in OI, along with a price increase.
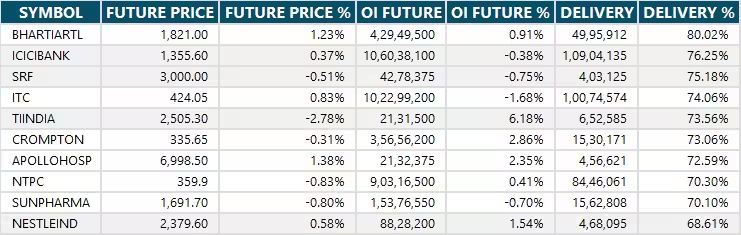
14) High Delivery Trades
Here are the stocks that saw a high share of delivery trades. A high share of delivery reflects investing (as opposed to trading) interest in a stock.
15) Stocks Under F&O Ban
Securities banned under the F&O segment include companies where derivative contracts cross 95 percent of the market-wide position limit.
Stocks added to F&O ban: IREDA
Stocks retained in F&O ban: Birlasoft, Hindustan Copper, Manappuram Finance, National Aluminium Company
Stocks removed from F&O ban: Nil


0 Comment