21 Apr , 2025 By : Debdeep Gupta

Bulls maintained their consistent support in the market for four consecutive days, propelling the Nifty 50 to its previous swing high zone on April 17 with a robust 1.77 percent rally, led by banks. A sharp downtick in the VIX also played a supportive role. The index closed well above the midline of the Bollinger Bands on a weekly basis, which is a positive sign, along with a healthy bias in momentum indicators. According to experts, the index may face resistance at 24,000—this level coincides with the 50% Fibonacci retracement from the September 2024 high to the April 2025 low. A breakout above this could open the door to the 24,200 zone, while 23,650–23,550 is expected to act as a key support area in the short term.
Here are 15 data points we have collated to help you spot profitable trades:
1) Key Levels For The Nifty 50 (23,852)
Resistance based on pivot points: 23,893, 24,029, and 24,248
Support based on pivot points: 23,455, 23,320, and 23,101
Special Formation: The Nifty 50 formed a robust bullish candle on the daily charts with above-average volumes, trading close to the upper band of the Bollinger Bands. The index sustained well above all key moving averages, with momentum indicators showing strength. The Relative Strength Index (RSI) remained above the 60 mark at 62.57, and the Moving Average Convergence Divergence (MACD) maintained a positive crossover with a healthy histogram—both indicating a continued positive trend.
2) Key Levels For The Bank Nifty (54,290)
Resistance based on pivot points: 54,433, 54,745, and 55,250
Support based on pivot points: 53,422, 53,110, and 52,605
Resistance based on Fibonacci retracement: 56,307, 58,648
Support based on Fibonacci retracement: 52,825, 51,846
Special Formation: The Bank Nifty outperformed the Nifty 50, rising 2.21 percent and climbing above the upper band of the Bollinger Bands. Almost all key moving averages are trending upward, and volume remained above average for the third straight session. The index is now just a few points away from its record high. A long bullish candle was formed on the daily timeframe, supported by strong bias in RSI and MACD, indicating a healthy uptrend.
3) Nifty Call Options Data
According to the weekly options data, the maximum Call open interest was seen at the 25,000 strike (with 79.54 lakh contracts). This level can act as a key resistance for the Nifty in the short term. It was followed by the 24,000 strike (55.9 lakh contracts), and the 24,500 strike (55.22 lakh contracts).
Maximum Call writing was observed at the 25,000 strike, which saw an addition of 29.84 lakh contracts, followed by the 24,500 and 24,200 strikes, which added 20.01 lakh and 15.26 lakh contracts, respectively. The maximum Call unwinding was seen at the 23,500 strike, which shed 5.25 lakh contracts, followed by 23,700 and 23,300 strikes, which shed 4.35 lakh and 3.82 lakh contracts, respectively.
4) Nifty Put Options Data
On the Put side, the 23,500 strike holds the maximum Put open interest (with 83.91 lakh contracts), which can act as a key support level for the Nifty. It was followed by the 23,000 strike (69.77 lakh contracts) and the 23,300 strike (45.04 lakh contracts).
The maximum Put writing was placed at the 23,500 strike, which saw an addition of 36.49 lakh contracts, followed by the 23,800 and 23,600 strikes, which added 17.12 lakh and 17 lakh contracts, respectively. The maximum Put unwinding was seen at the 22,900 strike, which shed 1.55 lakh contracts, followed by the 25,000 and 22,950 strikes, which shed 42,150 and 13,875 contracts, respectively.
5) Bank Nifty Call Options Data
According to the monthly options data, the maximum Call open interest was seen at the 55,000 strike, with 17.56 lakh contracts. This can act as a key resistance level for the index in the short term. It was followed by the 53,000 strike (10.42 lakh contracts) and the 54,000 strike (10.04 lakh contracts).
Maximum Call writing was visible at the 55,500 strike (with the addition of 3.76 lakh contracts), followed by the 55,000 strike (2.74 lakh contracts) and the 54,300 strike (2.63 lakh contracts). The maximum Call unwinding was seen at the 53,000 strike, which shed 3.91 lakh contracts, followed by the 54,000 and 52,000 strikes, which shed 2.48 lakh and 2.02 lakh contracts, respectively.
6) Bank Nifty Put Options Data
On the Put side, the 52,000 strike holds the maximum Put open interest (with 13.01 lakh contracts), which can act as a key support level for the index. This was followed by the 53,000 strike (11.47 lakh contracts) and the 52,500 strike (9.79 lakh contracts).
The maximum Put writing was observed at the 54,000 strike (which added 5.66 lakh contracts), followed by the 53,500 strike (4.71 lakh contracts) and the 53,300 strike (2.3 lakh contracts). The maximum Put unwinding was seen at the 52,400 strike, which shed 87,030 contracts, followed by the 52,700 and 52,100 strikes, which shed 70,950 and 58,050 contracts, respectively.
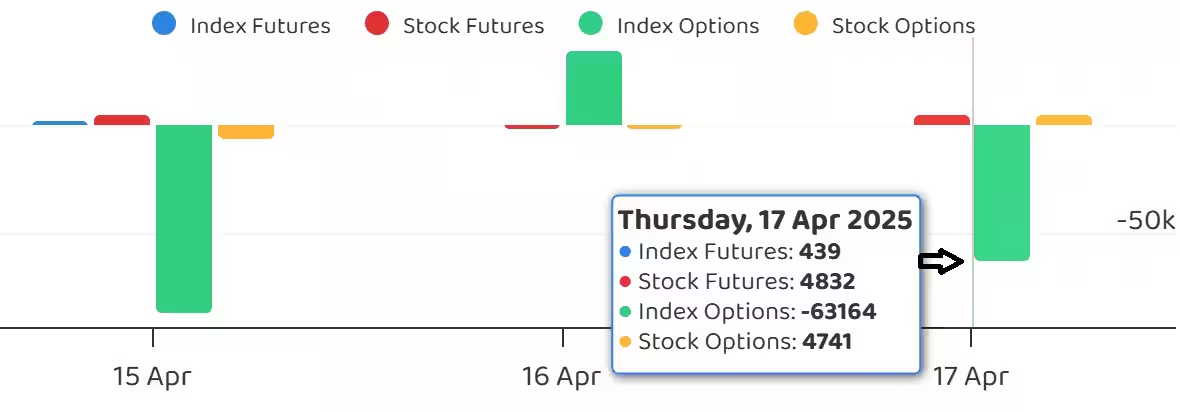
7) Funds Flow (Rs crore)
8) Put-Call Ratio
The Nifty Put-Call ratio (PCR), which indicates the mood of the market, jumped to 1.17 on April 17, against 0.98 in the previous session.
The increasing PCR, or being higher than 0.7 or surpassing 1, means traders are selling more Put options than Call options, which generally indicates the firming up of a bullish sentiment in the market. If the ratio falls below 0.7 or moves towards 0.5, then it indicates selling in Calls is higher than selling in Puts, reflecting a bearish mood in the market.
9) India VIX
The India VIX, which measures expected market volatility, continued to decline for the fourth consecutive session and remained below the 16 mark, providing further comfort to bulls. The index fell by 2.51 percent to settle at 15.47 levels.
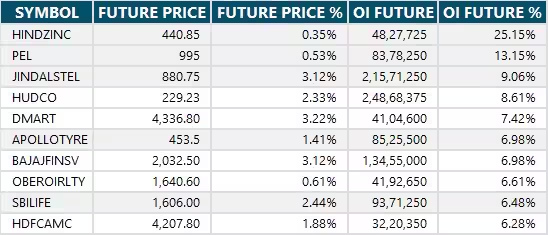
10) Long Build-up (111 Stocks)
A long build-up was seen in 111 stocks. An increase in open interest (OI) and price indicates a build-up of long positions.
11) Long Unwinding (14 Stocks)
14 stocks saw a decline in open interest (OI) along with a fall in price, indicating long unwinding.
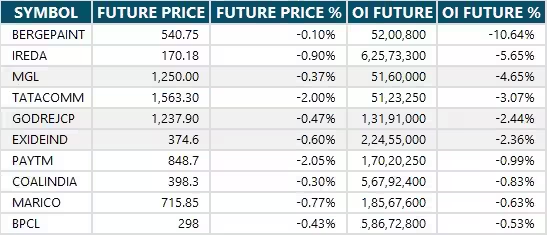
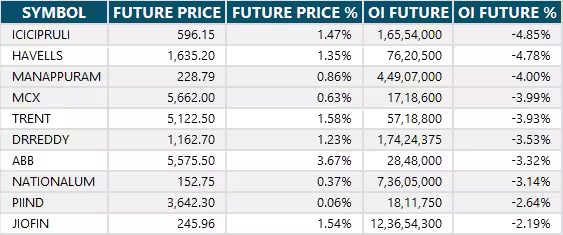
12) Short Build-up (46 Stocks)
46 stocks saw an increase in OI along with a fall in price, indicating a build-up of short positions.
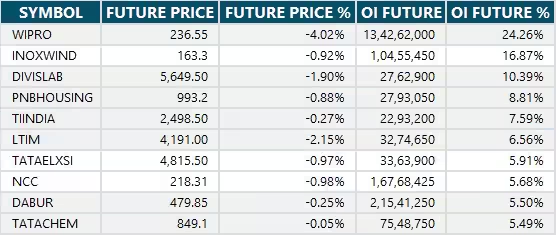
13) Short-Covering (51 Stocks)
51 stocks saw short-covering, meaning a decrease in OI, along with a price increase.
14) High Delivery Trades
Here are the stocks that saw a high share of delivery trades. A high share of delivery reflects investing (as opposed to trading) interest in a stock.

15) Stocks Under F&O Ban
Securities banned under the F&O segment include companies where derivative contracts cross 95 percent of the market-wide position limit.
Stocks added to F&O ban: Angel One
Stocks retained in F&O ban: Hindustan Copper, IREDA, Manappuram Finance, National Aluminium Company
Stocks removed from F&O ban: Birlasoft


0 Comment