21 Nov , 2025 By : Debdeep Gupta

The Nifty 50 staged a strong performance, not only surpassing the double-top resistance of 26,100 but also inching closer to the record high zone, ending with more than half a percent rally despite weak market breadth on November 20. Given the strengthening momentum, experts expect the Nifty 50 to touch its record high of 26,277 soon, provided it holds 26,100 as an immediate support. Beyond this, 26,500 is the level to watch, while the sacrosanct support is placed at 25,800.
Here are 15 data points we have collated to help you spot profitable trades:
1) Key Levels For The Nifty 50 (26,192)
Resistance based on pivot points: 26,237, 26,281, and 26,351
Support based on pivot points: 26,097, 26,054, and 25,984
Special Formation: The Nifty 50 formed a bullish candle with upper and lower shadows on the daily charts above its previous closing high, indicating continuation of the uptrend despite volatility. The index also closed above the falling resistance trendline, with key moving averages trending upward. The RSI, at 67.66, and the Stochastic RSI sustained their bullish crossovers, while the MACD maintained its positive crossover with further strength in the histogram. All this indicates strengthening momentum and a continuation of the prevailing bullish trend.
2) Key Levels For The Bank Nifty (59,348)
Resistance based on pivot points: 59,425, 59,499, and 59,619
Support based on pivot points: 59,184, 59,110, and 58,989
Resistance based on Fibonacci retracement: 59,455, 60,875
Support based on Fibonacci retracement: 58,901, 58,568
Special Formation: The Bank Nifty remained in uncharted territory, hitting a fresh record high of 59,440 and closing with 0.22 percent gains. The index formed a bullish candle with upper and lower shadows on the daily timeframe and closed above the previous day’s high, signalling an upward continuation pattern despite volatility. The RSI climbed to 74, and the MACD sustained its positive crossover with further increase in the histogram. All this indicates strong bullish momentum in the banking space.
3) Nifty Call Options Data
According to the monthly options data, the maximum Call open interest was seen at the 26,500 strike (with 1.16 crore contracts). This level can act as a key resistance level for the Nifty in the short term. It was followed by the 27,000 strike (1.12 crore contracts) and 26,200 strike (75.6 lakh contracts).
Maximum Call writing was observed at the 26,700 strike, which saw an addition of 17.53 lakh contracts, followed by the 27,000 and 26,250 strikes, which added 16.42 lakh and 16.11 lakh contracts, respectively. The maximum Call unwinding was seen at the 26,000 strike, which shed 44.86 lakh contracts, followed by the 26,100 and 26,050 strikes, which shed 17.88 lakh and 14.98 lakh contracts, respectively.
4) Nifty Put Options Data
On the Put side, the 26,000 strike holds the maximum Put open interest (with 1.48 crore contracts), which can act as a key support level for the Nifty in the short term. It was followed by the 25,900 strike (1.22 crore contracts) and the 25,500 strike (99.34 lakh contracts).
The maximum Put writing was placed at the 26,200 strike, which saw an addition of 56.7 lakh contracts, followed by the 26,100 and 26,150 strikes, which added 54.95 lakh and 36.36 lakh contracts, respectively. The maximum Put unwinding was seen at the 25,850 strike which shed 3.8 lakh contracts, followed by the 25,400 and 27,000 strikes, which shed 2.69 lakh and 92,025 contracts, respectively.
5) Bank Nifty Call Options Data
According to the monthly options data, the 60,000 strike holds the maximum Call open interest, with 11.95 lakh contracts. This can act as a key resistance level for the index in the short term. It was followed by the 59,000 strike (9.12 lakh contracts) and the 59,500 strike (8.3 lakh contracts).
Maximum Call writing was observed at the 59,500 strike (with the addition of 1.69 lakh contracts), followed by the 59,400 strike (1.66 lakh contracts) and 59,300 strike (48,440 contracts). The maximum Call unwinding was seen at the 58,500 strike, which shed 2.52 lakh contracts, followed by the 59,000 and 59,100 strikes, which shed 1.56 lakh and 1.23 lakh contracts, respectively.
6) Bank Nifty Put Options Data
On the Put side, the maximum Put open interest was seen at the 58,000 strike (with 15.28 lakh contracts), which can act as a key support level for the index. This was followed by the 59,000 strike (14.51 lakh contracts) and the 58,500 strike (13.47 lakh contracts).
The maximum Put writing was placed at the 59,300 strike (which added 2.73 lakh contracts), followed by the 59,500 strike (2.43 lakh contracts) and the 59,400 strike (2.03 lakh contracts). The maximum Put unwinding was seen at the 58,500 strike, which shed 2.21 lakh contracts, followed by the 58,400 and 57,800 strikes, which shed 1.79 lakh and 1.25 lakh contracts, respectively.
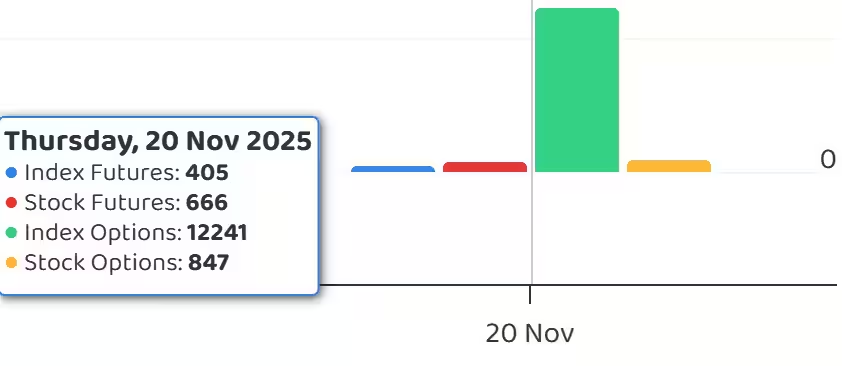
7) Funds Flow (Rs crore)
8) Put-Call Ratio
The Nifty Put-Call ratio (PCR), which indicates the mood of the market, climbed to 1.44 (the highest level since September 20, 2024) on November 20, compared to 1.29 in the previous session.
The increasing PCR, or being higher than 0.7 or surpassing 1, means traders are selling more Put options than Call options, which generally indicates the firming up of a bullish sentiment in the market. If the ratio falls below 0.7 or moves towards 0.5, then it indicates selling in Calls is higher than selling in Puts, reflecting a bearish mood in the market.
9) India VIX
The India VIX, also known as the fear gauge, remained well below the crucial 13 zone and hovered around short-term moving averages, despite Thursday’s 1.36 percent rise to the 12.14 zone, signalling comfort for bulls.
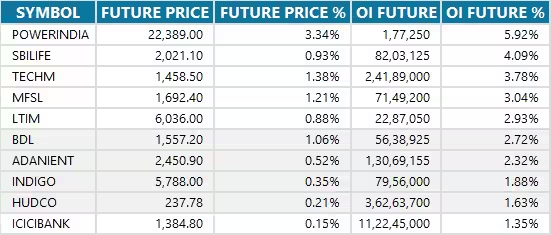
10) Long Build-up (32 Stocks)
A long build-up was seen in 32 stocks. An increase in open interest (OI) and price indicates a build-up of long positions.
11) Long Unwinding (69 Stocks)
69 stocks saw a decline in open interest (OI) along with a fall in price, indicating long unwinding.
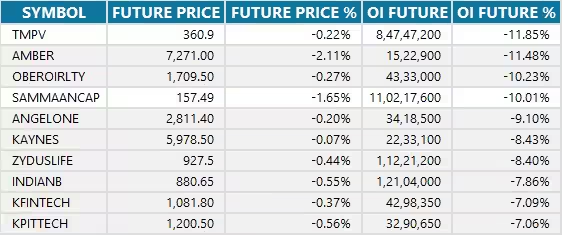
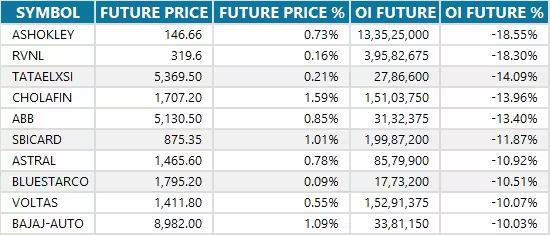
12) Short Build-up (37 Stocks)
37 stocks saw an increase in OI along with a fall in price, indicating a build-up of short positions.
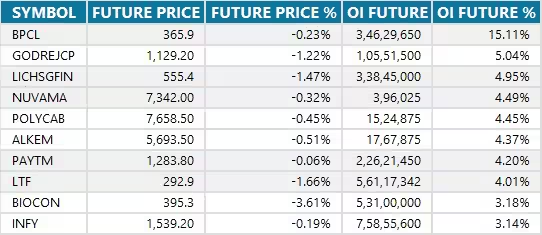
13) Short-Covering (75 Stocks)
75 stocks saw short-covering, meaning a decrease in OI, along with a price increase.
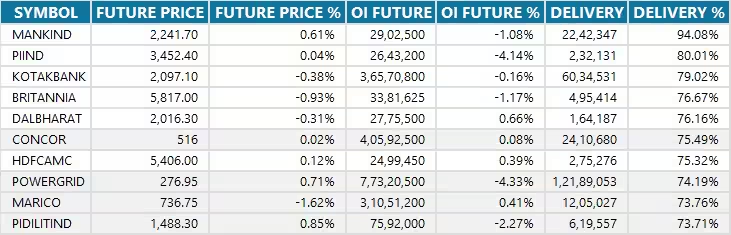
14) High Delivery Trades
Here are the stocks that saw a high share of delivery trades. A high share of delivery reflects investing (as opposed to trading) interest in a stock.
15) Stocks Under F&O Ban
Securities banned under the F&O segment include companies where derivative contracts cross 95 percent of the market-wide position limit.
Stocks added to F&O ban: Nil
Stocks retained in F&O ban: SAIL, Sammaan Capital
Stocks removed from F&O ban: Nil


0 Comment