11 Jul , 2025 By : Debdeep Gupta

The Nifty 50 decisively broke the 25,400 level, which had been consistently defended in the previous six sessions, and closed with a 121-point loss on July 10, the weekly F&O expiry day. The formation of a long red candle, along with negative crossovers in momentum indicators and a weakening MACD histogram, signalled a further downtrend despite the VIX reaching a more than 14-month low. If the index breaks the crucial support zone of 25,300–25,200, the 25,000 level is the one to watch on the downside. However, on the higher side, 25,500 is expected to act as resistance, according to experts.
Here are 15 data points we have collated to help you spot profitable trades:
1) Key Levels For The Nifty 50 (25,355)
Resistance based on pivot points: 25,477, 25,520, and 25,590
Support based on pivot points: 25,336, 25,293, and 25,223
Special Formation: The Nifty 50 has seen a consolidation breakdown and formed a long bearish candle on the daily charts, although the volume was lower than the previous day. The index dropped below the 10-day EMA but managed to defend the rising support trendline (which previously acted as a resistance trendline) on a closing basis. It still holds the 20-day EMA (25,285) and 20-day SMA (25,244). However, the RSI (at 55.82), Stochastic RSI, and MACD all showed negative crossovers, with further weakness in the histogram, signalling a negative trend.
2) Key Levels For The Bank Nifty (56,956)
Resistance based on pivot points: 57,251, 57,364, and 57,546
Support based on pivot points: 56,887, 56,774, and 56,592
Resistance based on Fibonacci retracement: 57,566, 58,224
Support based on Fibonacci retracement: 56,681, 56,389
Special Formation: The Bank Nifty also reported a long bearish candle on the daily timeframe, following a Doji formation in the previous session. The index has broken below the 10-day EMA but still holds above the 20-day EMA (56,728) and the previous week's low (56,623). The RSI, at 56.32, is below the 60 mark, and both the Stochastic RSI and MACD recorded negative crossovers, with bearish momentum in the histogram—signalling that bears may be gaining strength.
3) Nifty Call Options Data
According to the weekly options data, the maximum Call open interest was seen at the 25,500 strike (with 65.92 lakh contracts). This level can act as a key resistance for the Nifty in the short term. It was followed by the 26,000 strike (51.77 lakh contracts), and the 25,600 strike (49.42 lakh contracts).
Maximum Call writing was observed at the 25,500 strike, which saw an addition of 38.9 lakh contracts, followed by the 25,400 and 25,600 strikes, which added 36.93 lakh and 30.17 lakh contracts, respectively. There was hardly any Call unwinding seen in the 24,700-26,150 strike band.
4) Nifty Put Options Data
On the Put side, the 25,500 strike holds the maximum Put open interest (with 37.96 lakh contracts), which can act as a key level for the Nifty. It was followed by the 25,000 strike (36.82 lakh contracts) and the 25,400 strike (35.02 lakh contracts).
The maximum Put writing was placed at the 25,100 strike, which saw an addition of 20.02 lakh contracts, followed by the 25,400 and 25,000 strikes, which added 19.44 lakh and 16.98 lakh contracts, respectively. The maximum Put unwinding was seen at the 25,550 strike, which shed 1.36 lakh contracts, followed by the 26,000 and 25,650 strikes, which shed 32,700 and 25,800 contracts, respectively.
5) Bank Nifty Call Options Data
According to the monthly options data, the 56,000 strike still holds the maximum Call open interest, with 13.9 lakh contracts. This can act as a key level for the index in the short term. It was followed by the 57,000 strike (11.95 lakh contracts) and the 57,500 strike (10.66 lakh contracts).
Maximum Call writing was visible at the 57,000 strike (with the addition of 1.44 lakh contracts), followed by the 57,500 strike (90,370 contracts), and the 57,200 strike (78,925 contracts). The maximum Call unwinding was seen at the 58,700 strike, which shed 14,700 contracts, followed by the 58,000 and 56,000 strikes, which shed 8,190 and 1,960 contracts, respectively.
6) Bank Nifty Put Options Data
On the Put side, the maximum Put open interest was seen at the 56,000 strike (with 21.8 lakh contracts), which can act as a key support level for the index. This was followed by the 57,000 strike (12.33 lakh contracts) and the 56,500 strike (6.4 lakh contracts).
The maximum Put writing was observed at the 56,500 strike (which added 19,740 contracts), followed by the 55,200 strike (18,445 contracts) and the 55,800 strike (15,155 contracts). The maximum Put unwinding was seen at the 57,000 strike, which shed 1.11 lakh contracts, followed by the 57,500 and 57,200 strikes, which shed 61,075 and 57,890 contracts, respectively.
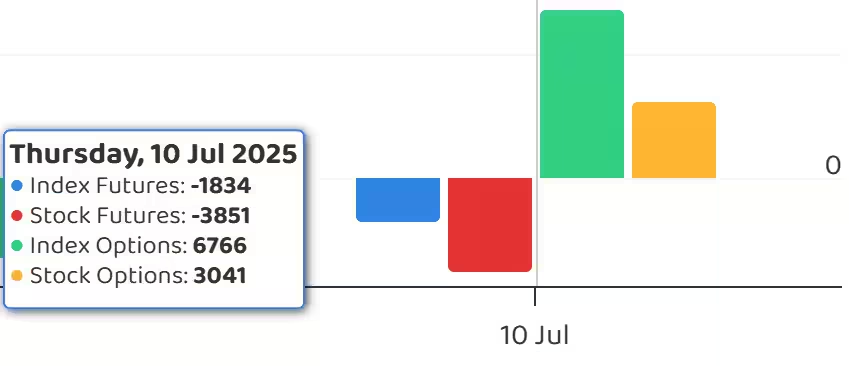
7) Funds Flow (Rs crore)
8) Put-Call Ratio
The Nifty Put-Call ratio (PCR), which indicates the mood of the market, jumped to 0.97 on July 10, compared to 0.89 in the previous session.
The increasing PCR, or being higher than 0.7 or surpassing 1, means traders are selling more Put options than Call options, which generally indicates the firming up of a bullish sentiment in the market. If the ratio falls below 0.7 or moves towards 0.5, then it indicates selling in Calls is higher than selling in Puts, reflecting a bearish mood in the market.
9) India VIX
The India VIX, which measures expected market volatility, dropped further and reached its lowest level in over 14 months on Thursday, which is generally favourable for bulls. It declined 2.24 percent to 11.67, marking the lowest closing level since April 26, 2024.
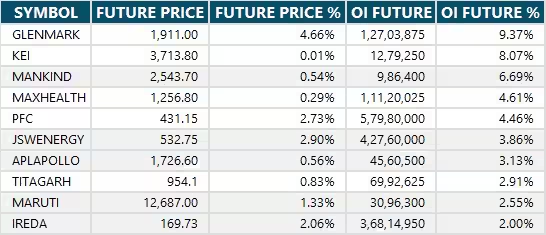
10) Long Build-up (27 Stocks)
A long build-up was seen in 27 stocks. An increase in open interest (OI) and price indicates a build-up of long positions.
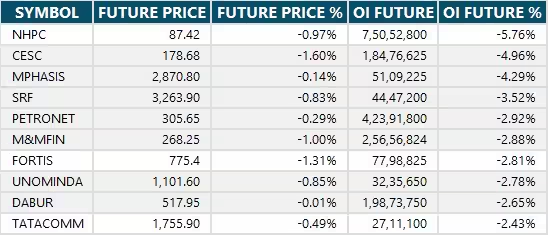
11) Long Unwinding (81 Stocks)
81 stocks saw a decline in open interest (OI) along with a fall in price, indicating long unwinding.
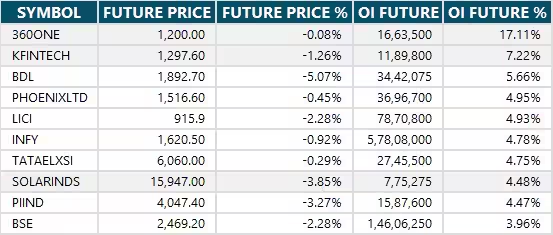
12) Short Build-up (75 Stocks)
75 stocks saw an increase in OI along with a fall in price, indicating a build-up of short positions.
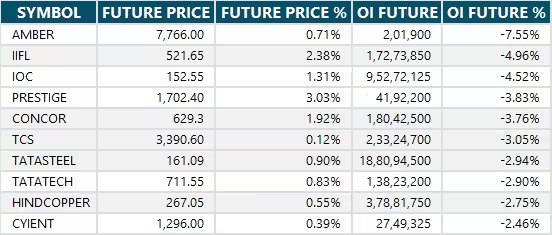
13) Short-Covering (45 Stocks)
45 stocks saw short-covering, meaning a decrease in OI, along with a price increase.
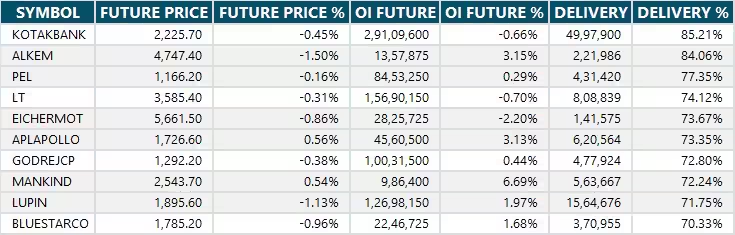
14) High Delivery Trades
Here are the stocks that saw a high share of delivery trades. A high share of delivery reflects investing (as opposed to trading) interest in a stock.
15) Stocks Under F&O Ban
Securities banned under the F&O segment include companies where derivative contracts cross 95 percent of the market-wide position limit.
Stocks added to F&O ban: Nil
Stocks retained in F&O ban: Hindustan Copper, RBL Bank
Stocks removed from F&O ban: Nil


0 Comment