10 Jul , 2025 By : Debdeep Gupta

The Nifty 50 failed to extend the previous day's upward momentum and ended the choppy session with moderate losses of 46 points on July 9. However, the index continued to hold above the 10-day and 20-day EMAs, while the RSI remained above the 60 mark, and the India VIX dropped to its lowest level in over 13 months. Collectively, these indicators suggest that the underlying trend remains positive, despite potential choppiness and consolidation in the near term. From a levels perspective, a decisive move above the 25,550 zone could open the path toward 25,700–25,800. Conversely, a break below the 25,400–25,300 support zone could lead the index toward 25,200–25,000, according to experts.
Here are 15 data points we have collated to help you spot profitable trades:
1) Key Levels For The Nifty 50 (25,476)
Resistance based on pivot points: 25,531, 25,560, and 25,607
Support based on pivot points: 25,436, 25,406, and 25,359
Special Formation: The Nifty 50 formed a bearish candle with upper and lower shadows on the daily chart, reflecting a rangebound session. Despite this, the index continued to sustain above the 10-day EMA. The upper band of the Bollinger Bands expanded further, indicating the potential for increased volatility. The MACD remained above the zero line, signaling that the broader trend is still intact, though a minor negative crossover and weakness in the histogram were noted. The RSI stayed above the 60 mark, although it showed a negative crossover in the upper band, hinting at a possible slowdown in momentum.
2) Key Levels For The Bank Nifty (57,214)
Resistance based on pivot points: 57,277, 57,337, and 57,433
Support based on pivot points: 57,084, 57,025, and 56,928
Resistance based on Fibonacci retracement: 57,566, 58,224
Support based on Fibonacci retracement: 56,681, 56,389
Special Formation: The Bank Nifty formed a Doji-like candlestick pattern on Wednesday, following a bullish candle in the previous session, indicating indecision between bulls and bears. The index traded within the previous day's range, while continuing to hold well above the 10-day EMA. The RSI remained above the 60 zone, though a negative crossover was observed. Both the RSI and the Stochastic RSI moved sideways during the week, suggesting a neutral trend with no strong bullish or bearish bias.
3) Nifty Call Options Data
According to the weekly options data, the 26,000 strike holds the maximum Call open interest (with 1.63 crore contracts). This level can act as a key resistance for the Nifty in the short term. It was followed by the 25,500 strike (1.56 crore contracts), and the 25,600 strike (1.23 crore contracts).
Maximum Call writing was observed at the 25,500 strike, which saw an addition of 74.46 lakh contracts, followed by the 25,550 and 25,600 strikes, which added 49.33 lakh and 49.31 lakh contracts, respectively. The maximum Call unwinding was seen at the 25,200 strike, which shed 1.23 lakh contracts, followed by the 26,350, and 25,000 strikes, which shed 76,725 and 44,475 contracts, respectively.
4) Nifty Put Options Data
On the Put side, the maximum Put open interest was seen at the 25,400 strike (with 98.46 lakh contracts), which can act as a key support level for the Nifty. It was followed by the 25,500 strike (91.8 lakh contracts) and the 25,000 strike (89.99 lakh contracts).
The maximum Put writing was placed at the 24,900 strike, which saw an addition of 18.57 lakh contracts, followed by the 25,000 and 25,500 strikes, which added 10.29 lakh and 9.19 lakh contracts, respectively. The maximum Put unwinding was seen at the 25,400 strike, which shed 6.49 lakh contracts, followed by the 25,300 and 25,550 strikes, which shed 6.24 lakh and 4.33 lakh contracts, respectively.
5) Bank Nifty Call Options Data
According to the monthly options data, the maximum Call open interest was seen at the 56,000 strike, with 13.92 lakh contracts. This can act as a key level for the index in the short term. It was followed by the 57,000 strike (10.51 lakh contracts) and the 57,500 strike (9.75 lakh contracts).
Maximum Call writing was visible at the 57,200 strike (with the addition of 51,730 contracts), followed by the 57,600 strike (27,510 contracts), and the 57,700 strike (17,255 contracts). The maximum Call unwinding was seen at the 59,000 strike, which shed 62,650 contracts, followed by the 58,000 and 56,400 strikes, which shed 49,980 and 45,360 contracts, respectively.
6) Bank Nifty Put Options Data
On the Put side, the 56,000 strike holds the maximum Put open interest (with 21.74 lakh contracts), which can act as a key support level for the index. This was followed by the 57,000 strike (13.44 lakh contracts) and the 56,500 strike (6.21 lakh contracts).
The maximum Put writing was observed at the 57,900 strike (which added 53,725 contracts), followed by the 56,000 strike (34,020 contracts) and the 57,600 strike (8,820 contracts). The maximum Put unwinding was seen at the 56,900 strike, which shed 54,110 contracts, followed by the 56,800 and 57,500 strikes, which shed 45,815 and 40,250 contracts, respectively.
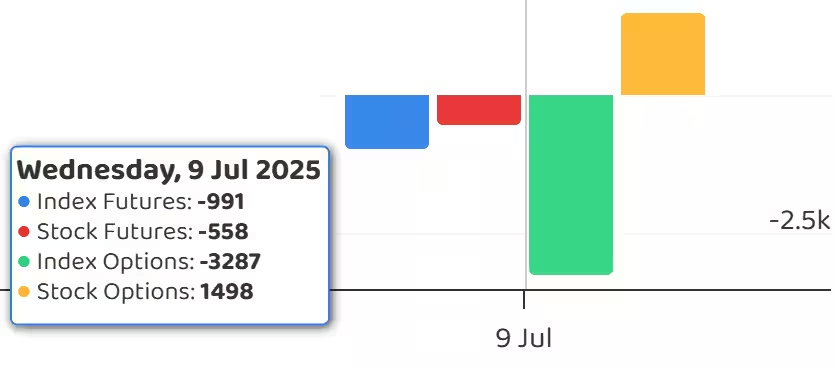
7) Funds Flow (Rs crore)
8) Put-Call Ratio
The Nifty Put-Call ratio (PCR), which indicates the mood of the market, declined to 0.89 on July 9, compared to 1.04 in the previous session.
The increasing PCR, or being higher than 0.7 or surpassing 1, means traders are selling more Put options than Call options, which generally indicates the firming up of a bullish sentiment in the market. If the ratio falls below 0.7 or moves towards 0.5, then it indicates selling in Calls is higher than selling in Puts, reflecting a bearish mood in the market.
9) India VIX
The India VIX, commonly referred to as the fear gauge, continued to remain in the lower zone, hitting a 13-month low on Wednesday. This supports a more comfortable environment for bulls. The VIX declined by 2.09 percent to 11.94, its lowest closing level since July 24, 2024.
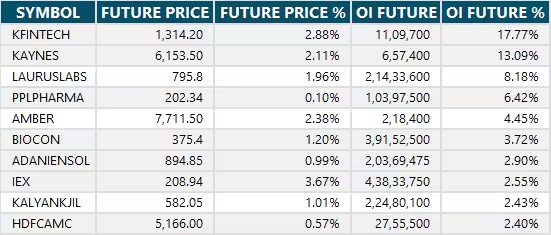
10) Long Build-up (46 Stocks)
A long build-up was seen in 46 stocks. An increase in open interest (OI) and price indicates a build-up of long positions.
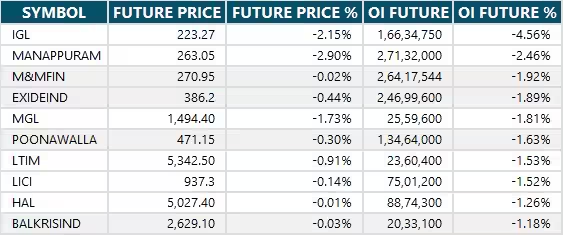
11) Long Unwinding (40 Stocks)
40 stocks saw a decline in open interest (OI) along with a fall in price, indicating long unwinding.
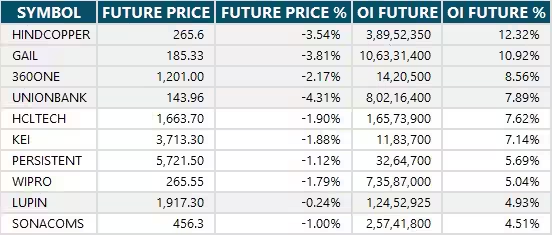
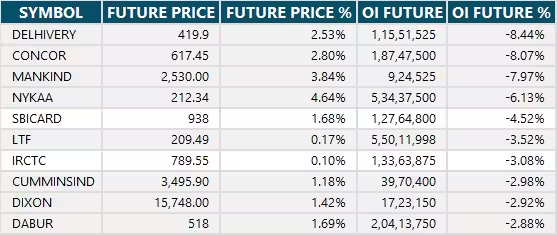
12) Short Build-up (93 Stocks)
93 stocks saw an increase in OI along with a fall in price, indicating a build-up of short positions.
13) Short-Covering (50 Stocks)
50 stocks saw short-covering, meaning a decrease in OI, along with a price increase.
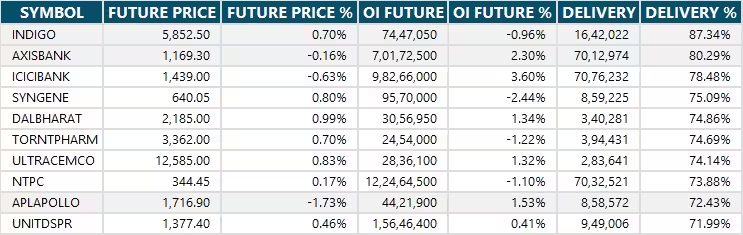
14) High Delivery Trades
Here are the stocks that saw a high share of delivery trades. A high share of delivery reflects investing (as opposed to trading) interest in a stock.
15) Stocks Under F&O Ban
Securities banned under the F&O segment include companies where derivative contracts cross 95 percent of the market-wide position limit.
Stocks added to F&O ban: Hindustan Copper
Stocks retained in F&O ban: RBL Bank
Stocks removed from F&O ban: Nil


0 Comment