09 Jul , 2025 By : Debdeep Gupta

The Nifty 50 saw an upside breakout from its recent rangebound action and finished the session with a 61-point gain on July 8, despite negative market breadth. The index sustained above short-term moving averages, with a positive crossover in momentum indicators and a breakout of the downward-sloping resistance trendline, indicating the possibility of a healthy trend. The 25,500 level is expected to be a crucial zone for the index in the upcoming sessions. If the index drops below this level, the 25,400–25,300 zone can act as support. However, if it holds above 25,500, a move toward 25,600–25,700 on the higher side can’t be ruled out, according to experts.
Here are 15 data points we have collated to help you spot profitable trades:
1) Key Levels For The Nifty 50 (25,523)
Resistance based on pivot points: 25,546, 25,575, and 25,622
Support based on pivot points: 25,451, 25,422, and 25,374
Special Formation: The Nifty 50 formed a bullish candle on the daily timeframe after breaking out of a falling resistance trendline, which is a positive sign. Furthermore, the index continued to hold above the 10-day EMA, while the RSI (at 62.53) and Stochastic RSI both showed positive crossovers. Trading volume was slightly better than in the previous couple of sessions.
2) Key Levels For The Bank Nifty (57,256)
Resistance based on pivot points: 57,306, 57,396, and 57,541
Support based on pivot points: 57,016, 56,926, and 56,781
Resistance based on Fibonacci retracement: 57,566, 58,224
Support based on Fibonacci retracement: 56,681, 56,389
Special Formation: The Bank Nifty also reported a bullish candle on the daily charts, following a Doji formation in the previous session. The index continued its higher high–higher low formation for another session and sustained above the 10-day EMA, which is positive. Additionally, the RSI (at 61.14) and the Stochastic RSI also recorded positive crossovers.
3) Nifty Call Options Data
According to the weekly options data, the maximum Call open interest was seen at the 26,000 strike (with 1.26 crore contracts). This level can act as a key resistance for the Nifty in the short term. It was followed by the 25,500 strike (82.08 lakh contracts), and the 25,600 strike (74.43 lakh contracts).
Maximum Call writing was observed at the 26,000 strike, which saw an addition of 21.67 lakh contracts, followed by the 25,700 and 26,050 strikes, which added 18.32 lakh and 9.79 lakh contracts, respectively. The maximum Call unwinding was seen at the 26,300 strike, which shed 15.12 lakh contracts, followed by the 25,400, and 25,750 strikes, which shed 10.31 lakh and 10.05 lakh contracts, respectively.
4) Nifty Put Options Data
On the Put side, the 25,400 strike holds the maximum Put open interest (with 1.04 crore contracts), which can act as a key support level for the Nifty. It was followed by the 25,500 strike (82.6 lakh contracts) and the 25,000 strike (79.69 lakh contracts).
The maximum Put writing was placed at the 25,400 strike, which saw an addition of 41.66 lakh contracts, followed by the 25,500 and 24,450 strikes, which added 32.67 lakh and 21.59 lakh contracts, respectively. The maximum Put unwinding was seen at the 25,300 strike, which shed 4.06 lakh contracts, followed by the 26,000 and 25,800 strikes, which shed 1.86 lakh and 55,125 contracts, respectively.
5) Bank Nifty Call Options Data
According to the monthly options data, the 56,000 strike holds the maximum Call open interest, with 13.96 lakh contracts. This can act as a key level for the index in the short term. It was followed by the 57,000 strike (10.56 lakh contracts) and the 57,500 strike (9.7 lakh contracts).
Maximum Call writing was visible at the 56,400 strike (with the addition of 52,290 contracts), followed by the 57,200 strike (39,480 contracts), and the 57,300 strike (37,975 contracts). The maximum Call unwinding was seen at the 57,000 strike, which shed 1.04 lakh contracts, followed by the 56,900 and 56,800 strikes, which shed 33,180 and 14,595 contracts, respectively.
6) Bank Nifty Put Options Data
On the Put side, the maximum Put open interest was seen at the 56,000 strike (with 21.4 lakh contracts), which can act as a key support level for the index. This was followed by the 57,000 strike (13.6 lakh contracts) and the 56,500 strike (6.21 lakh contracts).
The maximum Put writing was observed at the 57,100 strike (which added 79,205 contracts), followed by the 57,000 strike (75,950 contracts) and the 57,500 strike (69,580 contracts). The maximum Put unwinding was seen at the 55,900 strike, which shed 14,945 contracts, followed by the 57,900 and 56,400 strikes, which shed 11,585 and 5,775 contracts, respectively.
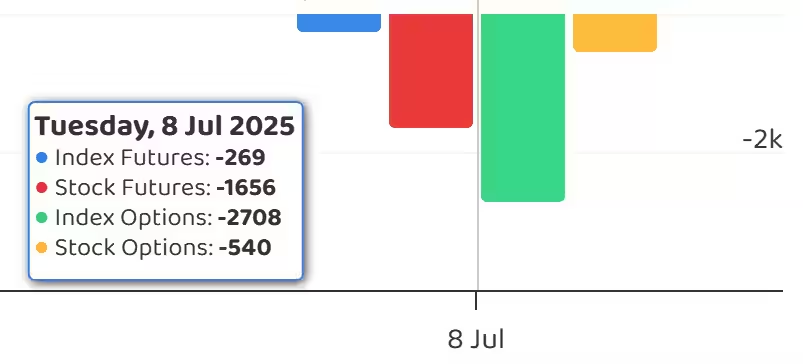
7) Funds Flow (Rs crore)
8) Put-Call Ratio
The Nifty Put-Call ratio (PCR), which indicates the mood of the market, jumped to 1.04 on July 8, compared to 0.95 in the previous session.
The increasing PCR, or being higher than 0.7 or surpassing 1, means traders are selling more Put options than Call options, which generally indicates the firming up of a bullish sentiment in the market. If the ratio falls below 0.7 or moves towards 0.5, then it indicates selling in Calls is higher than selling in Puts, reflecting a bearish mood in the market.
9) India VIX
The India VIX, which measures expected market volatility, hit a fresh nine-month low, offering more comfort to market bulls. It was down 2.91 percent to 12.20, marking the lowest closing level since October 1, 2024.
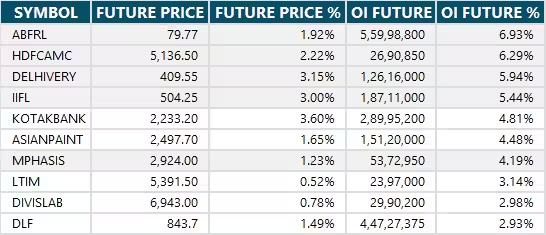
10) Long Build-up (60 Stocks)
A long build-up was seen in 60 stocks. An increase in open interest (OI) and price indicates a build-up of long positions.
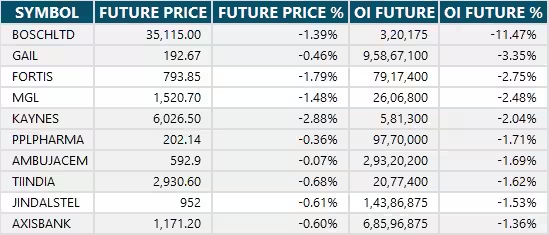
11) Long Unwinding (33 Stocks)
33 stocks saw a decline in open interest (OI) along with a fall in price, indicating long unwinding.
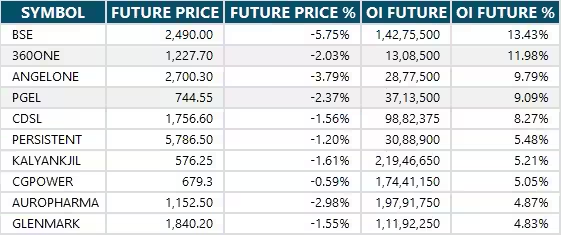
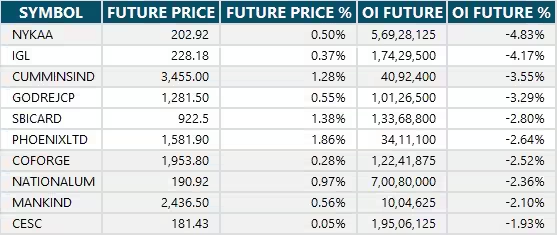
12) Short Build-up (77 Stocks)
77 stocks saw an increase in OI along with a fall in price, indicating a build-up of short positions.
13) Short-Covering (58 Stocks)
58 stocks saw short-covering, meaning a decrease in OI, along with a price increase.
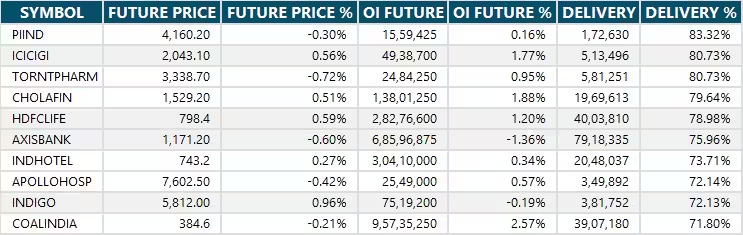
14) High Delivery Trades
Here are the stocks that saw a high share of delivery trades. A high share of delivery reflects investing (as opposed to trading) interest in a stock.
15) Stocks Under F&O Ban
Securities banned under the F&O segment include companies where derivative contracts cross 95 percent of the market-wide position limit.
Stocks added to F&O ban: Nil
Stocks retained in F&O ban: RBL Bank
Stocks removed from F&O ban: Nil


0 Comment