25 Jun , 2025 By : Debdeep Gupta

The Nifty 50 was poised for a stellar performance, given its morning rally of 345 points, but ended with just a 72-point gain due to profit booking in the afternoon trade amid concerns over uncertainty led by Middle East tensions. The index failed to defend the 25,200 and 25,300 levels on a closing basis, resulting in a false breakout on June 24, which indicates a likely continuation of consolidation within the 24,800–25,300 range. According to experts, unless the index delivers a decisive and sustained close above 25,300, consolidation may persist, with support seen in the 24,800–24,700 zone.
Here are 15 data points we have collated to help you spot profitable trades:
1) Key Levels For The Nifty 50 (25,044)
Resistance based on pivot points: 25,242, 25,317, and 25,439
Support based on pivot points: 24,999, 24,924, and 24,803
Special Formation: The Nifty 50 formed a bearish candle with an upper shadow on the daily charts, while also registering a higher high–higher low formation. Although the index surpassed both the upper line of the Bollinger Bands and the downward-sloping resistance trendline, it was unable to sustain above either level. On the positive side, the index remained above its short-term moving averages, which is a constructive signal. Additionally, the Stochastic RSI maintained a positive crossover, while the RSI, at 56.71, showed sideways movement.
2) Key Levels For The Bank Nifty (56,462)
Resistance based on pivot points: 56,757, 56,895, and 57,119
Support based on pivot points: 56,310, 56,171, and 55,947
Resistance based on Fibonacci retracement: 57,050, 57,588
Support based on Fibonacci retracement: 56,219, 56,018
Special Formation: The Bank Nifty formed a small bearish candle with long upper and lower shadows, resembling a high wave or Doji-like candlestick pattern (though not a classical one) on the daily timeframe—indicating indecision among bulls and bears. The index tested the upper line of the Bollinger Bands while staying above short-term moving averages. It also reported a higher top–higher bottom formation, with both the Stochastic RSI and RSI showing positive crossovers.
3) Nifty Call Options Data
According to the monthly options data, the maximum Call open interest was placed at the 25,200 strike (with 1.1 crore contracts). This level can act as a key resistance for the Nifty in the short term. It was followed by the 25,500 strike (1.01 crore contracts), and the 25,100 strike (89.87 lakh contracts).
Maximum Call writing was observed at the 25,200 strike, which saw an addition of 49.72 lakh contracts, followed by the 25,100 and 25,400 strikes, which added 37.88 lakh and 25.87 lakh contracts, respectively. The maximum Call unwinding was seen at the 25,000 strike, which shed 19.63 lakh contracts, followed by the 24,900 and 24,800 strikes, which shed 18.1 lakh and 8.09 lakh contracts, respectively.
4) Nifty Put Options Data
On the Put side, the 25,000 strike holds the maximum Put open interest (with 1.01 crore contracts), which can act as a key support level for the Nifty. It was followed by the 24,800 strike (79.41 lakh contracts) and the 24,500 strike (75.34 lakh contracts).
The maximum Put writing was placed at the 25,200 strike, which saw an addition of 35.19 lakh contracts, followed by the 25,100 and 25,300 strikes, which added 28.65 lakh and 19.86 lakh contracts, respectively. The maximum Put unwinding was seen at the 24,900 strike, which shed 18.05 lakh contracts, followed by the 24,600 and 24,950 strikes which shed 13.08 lakh and 5.35 lakh contracts, respectively.
5) Bank Nifty Call Options Data
According to the monthly options data, the 57,000 strike holds the maximum Call open interest, with 14.93 lakh contracts. This can act as a key resistance level for the index in the short term. It was followed by the 58,000 strike (14.76 lakh contracts) and the 56,000 strike (13.84 lakh contracts).
Maximum Call writing was visible at the 56,600 strike (with the addition of 2 lakh contracts), followed by the 58,500 strike (1.76 lakh contracts), and the 56,700 strike (1.55 lakh contracts). The maximum Call unwinding was seen at the 56,000 strike, which shed 6.31 lakh contracts, followed by the 57,000 and 56,200 strikes, which shed 2.4 lakh and 2.3 lakh contracts, respectively.
6) Bank Nifty Put Options Data
On the Put side, the maximum Put open interest was placed at the 56,000 strike (with 18.99 lakh contracts), which can act as a key support level for the index. This was followed by the 55,000 strike (12.65 lakh contracts) and the 55,500 strike (9.26 lakh contracts).
The maximum Put writing was observed at the 56,500 strike (which added 5.38 lakh contracts), followed by the 56,400 strike (2.15 lakh contracts) and the 56,600 strike (2.14 lakh contracts). The maximum Put unwinding was seen at the 56,000 strike, which shed 2.17 lakh contracts, followed by the 55,000 and 55,900 strikes, which shed 1.84 lakh and 1.35 lakh contracts, respectively.
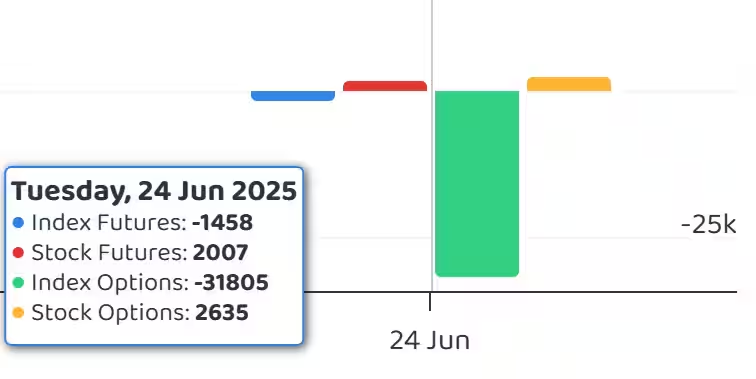
7) Funds Flow (Rs crore)
8) Put-Call Ratio
The Nifty Put-Call ratio (PCR), which indicates the mood of the market, fell further to 0.85 on June 24, compared to 1.04 in the previous session.
The increasing PCR, or being higher than 0.7 or surpassing 1, means traders are selling more Put options than Call options, which generally indicates the firming up of a bullish sentiment in the market. If the ratio falls below 0.7 or moves towards 0.5, then it indicates selling in Calls is higher than selling in Puts, reflecting a bearish mood in the market.
9) India VIX
The India VIX, which measures expected market volatility, remained supportive of the bulls as it continued to stay below the 15 mark. It fell 2.88 percent, closing at 13.64, helping maintain a relatively bullish sentiment in the market.
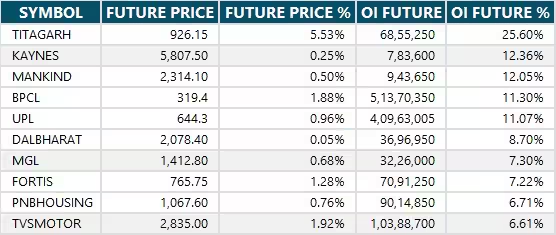
10) Long Build-up (100 Stocks)
A long build-up was seen in 100 stocks. An increase in open interest (OI) and price indicates a build-up of long positions.
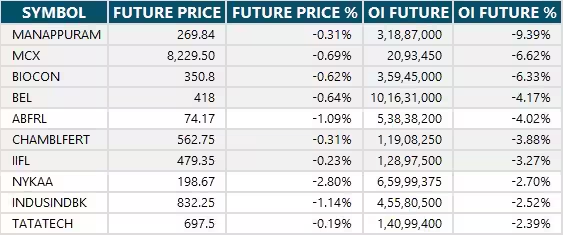
11) Long Unwinding (21 Stocks)
21 stocks saw a decline in open interest (OI) along with a fall in price, indicating long unwinding.
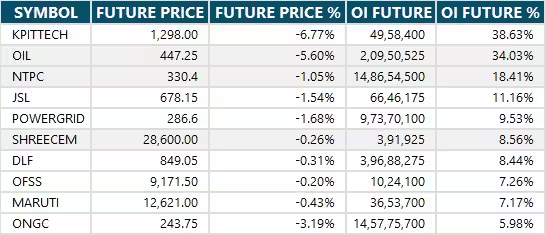
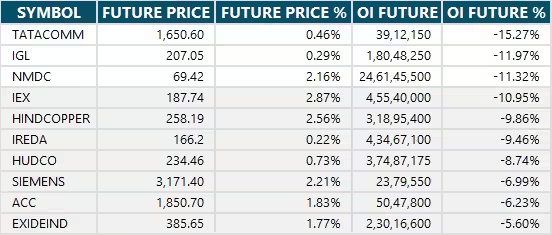
12) Short Build-up (31 Stocks)
31 stocks saw an increase in OI along with a fall in price, indicating a build-up of short positions.
13) Short-Covering (73 Stocks)
73 stocks saw short-covering, meaning a decrease in OI, along with a price increase.
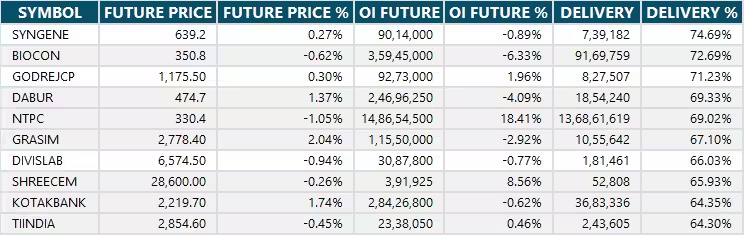
14) High Delivery Trades
Here are the stocks that saw a high share of delivery trades. A high share of delivery reflects investing (as opposed to trading) interest in a stock.
15) Stocks Under F&O Ban
Securities banned under the F&O segment include companies where derivative contracts cross 95 percent of the market-wide position limit.
Stocks added to F&O ban: Nil
Stocks retained in F&O ban: Titagarh Rail Systems
Stocks removed from F&O ban: Biocon, RBL Bank


0 Comment