23 Jun , 2025 By : Debdeep Gupta

The Nifty 50 gained solid strength on June 20 after a three-day consolidation and rallied 1.29 percent, reviving weak sentiment alongside a falling VIX. Despite the recovery, the index remains within the broad range of 24,450–25,200 for several weeks now. As long as the index trades below 25,200, and geopolitical tensions in the Middle East—which influence oil prices—persist, consolidation and mild correction within a range-bound setup may continue. Key support levels remain at 24,700, followed by the 24,500–24,450 zone, which is also where the 50-day EMA is placed, according to experts. A fall below this crucial support zone may trigger a forceful attack from bears, while a decisive and sustainable close above 25,200 can open the door for strong bullish action.
Here are 15 data points we have collated to help you spot profitable trades:
1) Key Levels For The Nifty 50 (25,112)
Resistance based on pivot points: 25,145, 25,229, and 25,363
Support based on pivot points: 24,876, 24,793, and 24,658
Special Formation: The Nifty 50 formed a long bullish candle on the daily chart after Doji-like candles in the previous two sessions, supported by above-average volumes. The index also climbed above short-term moving averages. On the weekly timeframe, it also formed a bullish candle, but the RSI at 60.81 remained sideways, signaling a lack of directional bias. Additionally, the Average Directional Index (ADX)—a measure of trend strength—stood at 13.32, its lowest level since July 2024, indicating weak trend momentum in either direction. Moreover, the Bollinger Bands on the daily chart have contracted significantly. This formation typically occurs when volatility drops to low levels and the price trades within compressed bands, often preceding a sharp breakout or breakdown, according to experts.
2) Key Levels For The Bank Nifty (56,253)
Resistance based on pivot points: 56,340, 56,520, and 56,811
Support based on pivot points: 55,758, 55,578, and 55,287
Resistance based on Fibonacci retracement: 56,643, 57,056
Support based on Fibonacci retracement: 55,149, 54,820
Special Formation: The Bank Nifty also traded in line with the benchmark Nifty 50, rising 1.2 percent to reclaim the 56,000 mark and filling the gap created by the June 13 sell-off. The index also moved above short-term moving averages, although the Bollinger Bands remained squeezed. The RSI at 57.77 inclined upward, and the MACD stayed well above the zero line, but both indicators still sustained negative crossovers, suggesting caution.
3) Nifty Call Options Data
According to the monthly options data, the maximum Call open interest was seen at the 26,000 strike (with 1.55 crore contracts). This level can act as a key resistance for the Nifty in the short term. It was followed by the 25,500 strike (82 lakh contracts), and the 25,000 strike (81.41 lakh contracts).
Maximum Call writing was observed at the 25,400 strike, which saw an addition of 27.24 lakh contracts, followed by the 26,000 and 25,600 strikes, which added 26.54 lakh and 19.86 lakh contracts, respectively. The maximum Call unwinding was seen at the 24,800 strike, which shed 15.64 lakh contracts, followed by the 24,700 and 24,900 strikes, which shed 6.94 lakh and 2.27 lakh contracts, respectively.
4) Nifty Put Options Data
On the Put side, the 25,000 strike holds the maximum Put open interest (with 97.91 lakh contracts), which can act as a key support level for the Nifty. It was followed by the 24,800 strike (86.9 lakh contracts) and the 24,500 strike (70.61 lakh contracts).
The maximum Put writing was placed at the 25,000 strike, which saw an addition of 58.21 lakh contracts, followed by the 24,900 and 25,100 strikes, which added 36.35 lakh and 30.82 lakh contracts, respectively. The maximum Put unwinding was seen at the 26,000 strike, which shed 1.17 lakh contracts, followed by the 25,800 and 25,900 strikes which shed 3,000 and 1,275 contracts, respectively.
5) Bank Nifty Call Options Data
According to the monthly options data, the 56,000 strike holds the maximum Call open interest, with 21.9 lakh contracts. This can act as a key decision level for the index in the short term. It was followed by the 57,000 strike (15.49 lakh contracts) and the 58,000 strike (14.22 lakh contracts).
Maximum Call writing was visible at the 56,300 strike (with the addition of 1.26 lakh contracts), followed by the 56,200 strike (1.1 lakh contracts), and the 58,000 strike (93,960 contracts). The maximum Call unwinding was seen at the 56,000 strike, which shed 3.49 lakh contracts, followed by the 55,800 and 55,700 strikes, which shed 2.41 lakh and 2.21 lakh contracts, respectively.
6) Bank Nifty Put Options Data
On the Put side, the maximum Put open interest remained at the 56,000 strike (with 23.09 lakh contracts), which can act as a key decision level for the index. This was followed by the 55,000 strike (16.42 lakh contracts) and the 55,500 strike (11.02 lakh contracts).
The maximum Put writing was observed at the 56,000 strike (which added 4.27 lakh contracts), followed by the 55,000 strike (3.11 lakh contracts) and the 56,200 strike (2.75 lakh contracts). The maximum Put unwinding was seen at the 54,400 strike, which shed 1.08 lakh contracts, followed by the 55,300 and 57,200 strikes, which shed 14,640 and 12,360 contracts, respectively.
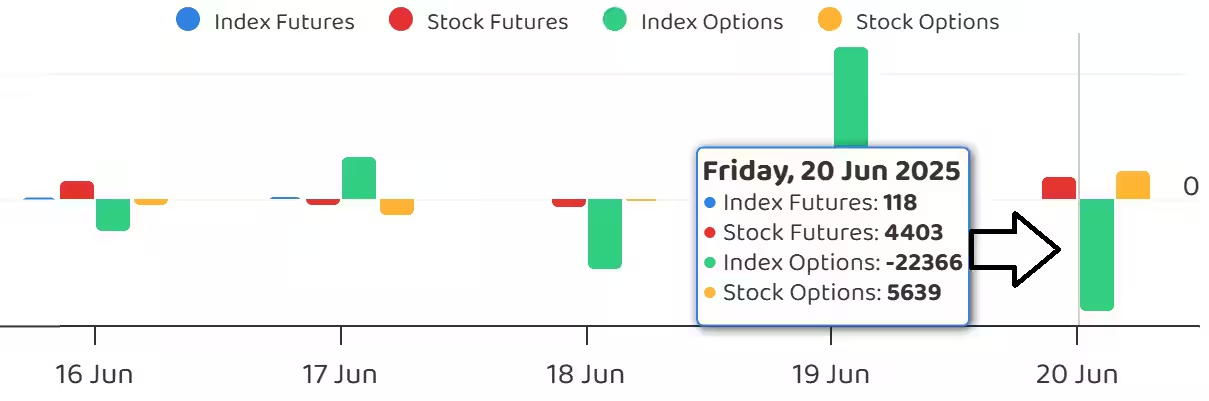
7) Funds Flow (Rs crore)
8) Put-Call Ratio
The Nifty Put-Call ratio (PCR), which indicates the mood of the market, jumped to 1.16 on June 20, compared to 1.03 in the previous session.
The increasing PCR, or being higher than 0.7 or surpassing 1, means traders are selling more Put options than Call options, which generally indicates the firming up of a bullish sentiment in the market. If the ratio falls below 0.7 or moves towards 0.5, then it indicates selling in Calls is higher than selling in Puts, reflecting a bearish mood in the market.
9) India VIX
The India VIX, which measures expected market volatility, maintained its downtrend throughout last week, falling 4.09 percent on Friday to 13.67 levels, providing more comfort to the bulls. As long as it remains below the 15 mark, bulls may stay in the comfort zone, but any spike above 15 could signal caution.
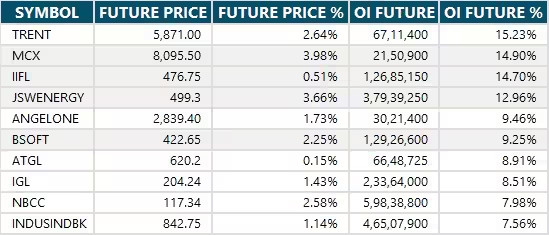
10) Long Build-up (104 Stocks)
A long build-up was seen in 104 stocks. An increase in open interest (OI) and price indicates a build-up of long positions.
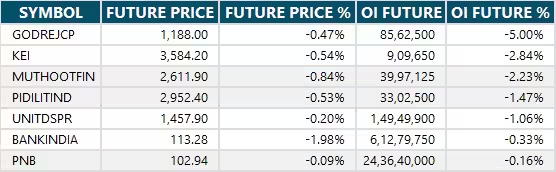
11) Long Unwinding (7 Stocks)
7 stocks saw a decline in open interest (OI) along with a fall in price, indicating long unwinding.
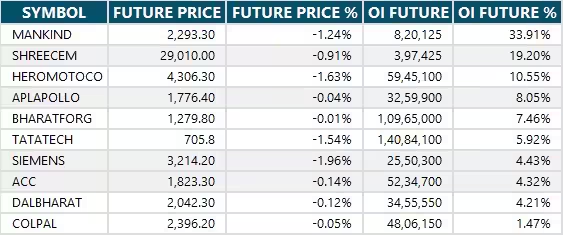
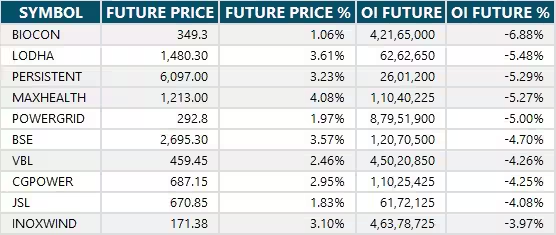
12) Short Build-up (13 Stocks)
13 stocks saw an increase in OI along with a fall in price, indicating a build-up of short positions.
13) Short-Covering (100 Stocks)
100 stocks saw short-covering, meaning a decrease in OI, along with a price increase.
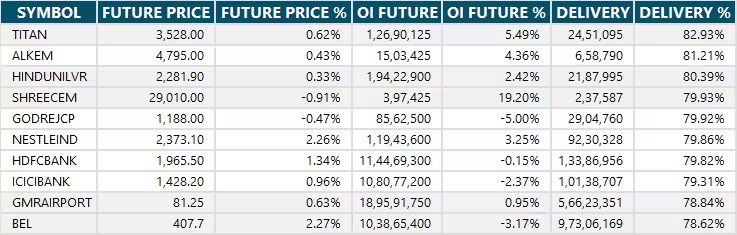
14) High Delivery Trades
Here are the stocks that saw a high share of delivery trades. A high share of delivery reflects investing (as opposed to trading) interest in a stock.
15) Stocks Under F&O Ban
Securities banned under the F&O segment include companies where derivative contracts cross 95 percent of the market-wide position limit.
Stocks added to F&O ban: Nil
Stocks retained in F&O ban: Aditya Birla Fashion and Retail, Biocon, RBL Bank, Titagarh Rail Systems
Stocks removed from F&O ban: Central Depository Services, HUDCO, Manappuram Finance


0 Comment