19 Jun , 2025 By : Debdeep Gupta

The Nifty 50 remained in a tight range of 24,700–25,000 for the third consecutive day and closed the consolidative session with moderate losses of 41 points on June 18, as traders maintained caution ahead of the Federal Reserve policy outcome, in which the central bank kept the interest rate steady at 4.25–4.50 percent. The index fell below the 20-day EMA and the midline of the Bollinger Bands, indicating some weakness, although the VIX turned more favourable for bulls. According to experts, unless the index breaks the range on either side, consolidation may continue. Below the lower boundary, 24,500 is the key level to watch; beyond 25,000, 25,200 is the possible resistance.
Here are 15 data points we have collated to help you spot profitable trades:
1) Key Levels For The Nifty 50 (24,812)
Resistance based on pivot points: 24,912, 24,959, and 25,034
Support based on pivot points: 24,761, 24,715, and 24,640
Special Formation: The Nifty 50 formed a small bullish candle with a long upper shadow on the daily timeframe, indicating pressure at higher levels and difficulty in crossing the 25,000 mark. The Bollinger Bands suggest a trading range of 24,500–25,200. The MACD histogram showed further weakness, with the MACD continuing in a negative crossover. The RSI remained above the 50 zone but also stayed in a negative crossover. The Stochastic RSI remained on the verge of a breakout, as observed since the previous session.
2) Key Levels For The Bank Nifty (55,829)
Resistance based on pivot points: 55,919, 56,019, and 56,180
Support based on pivot points: 55,597, 55,497, and 55,336
Resistance based on Fibonacci retracement: 56,099, 56,810
Support based on Fibonacci retracement: 55,266, 54,845
Special Formation: The Bank Nifty formed a bullish candle on the daily chart, closing 115 points higher. The index managed to defend the 20-day EMA and the midline of the Bollinger Bands. The Stochastic RSI showed a positive crossover below the lower band, while both the RSI and MACD remained in negative crossover, with the histogram showing further weakness.
3) Nifty Call Options Data
According to the weekly options data, the maximum Call open interest was seen at the 25,000 strike (with 1.37 crore contracts). This level can act as a key resistance for the Nifty in the short term. It was followed by the 25,500 strike (1.34 crore contracts), and the 24,900 strike (1.02 crore contracts).
Maximum Call writing was observed at the 24,800 strike, which saw an addition of 51.77 lakh contracts, followed by the 25,000 and 25,500 strikes, which added 43.14 lakh and 36.46 lakh contracts, respectively. The maximum Call unwinding was seen at the 25,350 strike, which shed 2.32 lakh contracts, followed by the 24,100 and 24,400 strikes, which shed 31,050 and 20,700 contracts, respectively.
4) Nifty Put Options Data
On the Put side, the 24,000 strike holds the maximum Put open interest (with 1.06 crore contracts), which can act as a key support level for the Nifty. It was followed by the 24,500 strike (70.16 lakh contracts) and the 24,800 strike (68.25 lakh contracts).
The maximum Put writing was placed at the 24,750 strike, which saw an addition of 10.41 lakh contracts, followed by the 24,400 and 24,000 strikes, which added 7.74 lakh and 7.57 lakh contracts, respectively. The maximum Put unwinding was seen at the 24,850 strike, which shed 11.9 lakh contracts, followed by the 24,900 and 25,000 strikes which shed 5.99 lakh and 4.61 lakh contracts, respectively.
5) Bank Nifty Call Options Data
According to the monthly options data, the maximum Call open interest was seen at the 56,000 strike, with 23.9 lakh contracts. This can act as a key resistance level for the index in the short term. It was followed by the 57,000 strike (16.21 lakh contracts) and the 56,500 strike (12.08 lakh contracts).
Maximum Call writing was visible at the 56,500 strike (with the addition of 1.72 lakh contracts), followed by the 57,500 strike (1.33 lakh contracts), and the 55,900 strike (57,990 contracts). The maximum Call unwinding was seen at the 57,800 strike, which shed 1.23 lakh contracts, followed by the 56,000 and 55,700 strikes, which shed 69,210 and 42,060 contracts, respectively.
6) Bank Nifty Put Options Data
On the Put side, the 56,000 strike holds the maximum Put open interest (with 20.1 lakh contracts), which can act as a key level for the index. This was followed by the 55,000 strike (14.3 lakh contracts) and the 54,000 strike (9.94 lakh contracts).
The maximum Put writing was observed at the 54,200 strike (which added 1.49 lakh contracts), followed by the 55,000 strike (1.48 lakh contracts) and the 55,900 strike (1.22 lakh contracts). The maximum Put unwinding was seen at the 54,000 strike, which shed 77,730 contracts, followed by the 56,500 and 57,000 strikes, which shed 24,270 and 8,310 contracts, respectively.
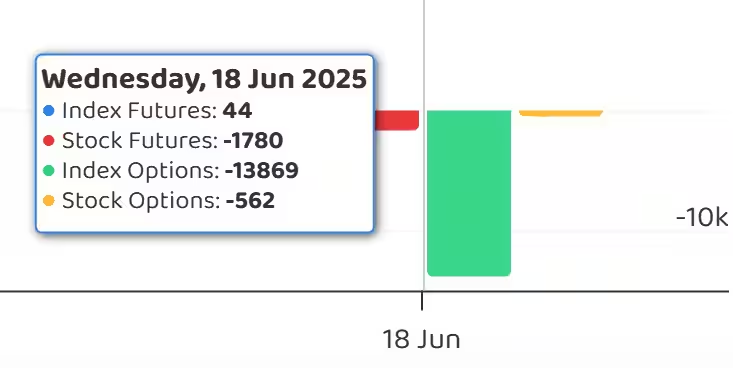
7) Funds Flow (Rs crore)
8) Put-Call Ratio
The Nifty Put-Call ratio (PCR), which indicates the mood of the market, dropped to 0.80 on June 18, compared to 0.95 in the previous session.
The increasing PCR, or being higher than 0.7 or surpassing 1, means traders are selling more Put options than Call options, which generally indicates the firming up of a bullish sentiment in the market. If the ratio falls below 0.7 or moves towards 0.5, then it indicates selling in Calls is higher than selling in Puts, reflecting a bearish mood in the market.
9) India VIX
The India VIX, which measures expected market volatility, remained below the 15 zone, closing 0.89 percent lower at 14.28. This remains favourable for bulls, as long as it stays below all key moving averages.
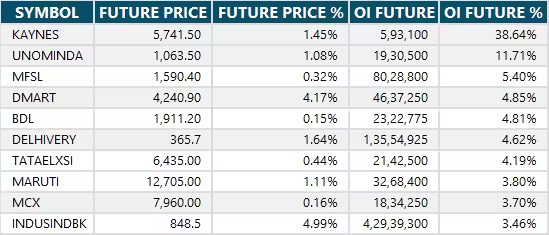
10) Long Build-up (45 Stocks)
A long build-up was seen in 45 stocks. An increase in open interest (OI) and price indicates a build-up of long positions.
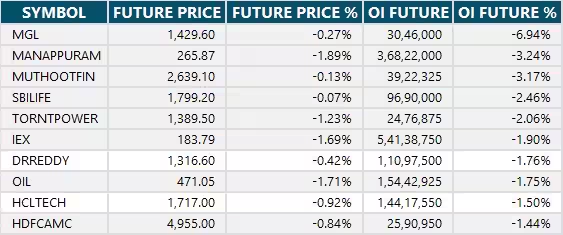
11) Long Unwinding (41 Stocks)
41 stocks saw a decline in open interest (OI) along with a fall in price, indicating long unwinding.
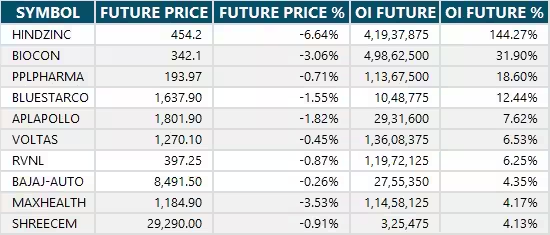
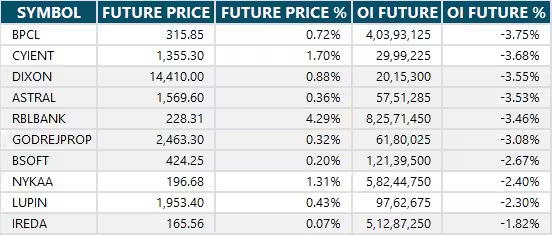
12) Short Build-up (107 Stocks)
107 stocks saw an increase in OI along with a fall in price, indicating a build-up of short positions.
13) Short-Covering (31 Stocks)
31 stocks saw short-covering, meaning a decrease in OI, along with a price increase.
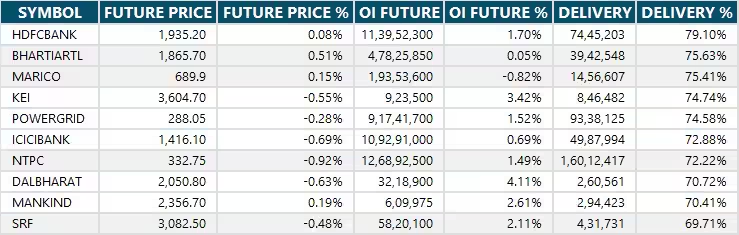
14) High Delivery Trades
Here are the stocks that saw a high share of delivery trades. A high share of delivery reflects investing (as opposed to trading) interest in a stock.
15) Stocks Under F&O Ban
Securities banned under the F&O segment include companies where derivative contracts cross 95 percent of the market-wide position limit.
Stocks added to F&O ban: Biocon
Stocks retained in F&O ban: Aditya Birla Fashion and Retail, Birlasoft, Central Depository Services, Chambal Fertilisers and Chemicals, HUDCO, Manappuram Finance, RBL Bank, Titagarh Rail Systems
Stocks removed from F&O ban: Indian Renewable Energy Development Agency (IREDA)


0 Comment