17 Jun , 2025 By : Debdeep Gupta

The Nifty 50 staged a healthy performance on June 16 after a couple of days of correction, rising nearly 1 percent to move closer to the 25,000 zone. The uptrend in global markets, despite ongoing geopolitical tensions, supported the rally. This upward move pushed the index above its short-term moving averages and the midline of the Bollinger Bands, signaling a positive bias. Experts note that as long as the index sustains above 24,800, an upward move toward the 25,000–25,200 zone is possible in the upcoming sessions. However, if it falls below 24,800, support is placed at 24,700, followed by 24,500.
Here are 15 data points we have collated to help you spot profitable trades:
1) Key Levels For The Nifty 50 (24,947)
Resistance based on pivot points: 24,973, 25,035, and 25,136
Support based on pivot points: 24,772, 24,710, and 24,609
Special Formation: The Nifty 50 formed a long bullish candlestick pattern on the daily charts for a second consecutive session, negating the lower tops and bottoms formation of the previous two sessions. It traded above short-term moving averages (10- and 20-day EMAs) and the midline of the Bollinger Bands. The Relative Strength Index (RSI) stood at 55.70, tilting upward, indicating a likely positive crossover.
2) Key Levels For The Bank Nifty (55,945)
Resistance based on pivot points: 56,012, 56,158, and 56,394
Support based on pivot points: 55,539, 55,393, and 55,157
Resistance based on Fibonacci retracement: 56,099, 56,810
Support based on Fibonacci retracement: 55,266, 54,845
Special Formation: The Bank Nifty also formed a bullish candle on the daily timeframe, negating the lower highs-lows formation of the previous four consecutive sessions. It almost filled the gap-down of June 13, which is considered a positive signal. The index climbed above the 20-day EMA and the midline of the Bollinger Bands. However, the Bank Nifty maintained a negative crossover on the Moving Average Convergence Divergence (MACD), with a further weakening histogram. The RSI held steady at 55.33, slightly above the 50 mark, and tilted upward, reflecting improving momentum.
3) Nifty Call Options Data
According to the weekly options data, the maximum Call open interest was seen at the 25,500 strike (with 82.08 lakh contracts). This level can act as a key resistance for the Nifty in the short term. It was followed by the 25,300 strike (74.71 lakh contracts), and the 25,200 strike (59.63 lakh contracts).
Maximum Call writing was observed at the 25,300 strike, which saw an addition of 23.66 lakh contracts, followed by the 25,500 and 25,400 strikes, which added 15.1 lakh and 11.78 lakh contracts, respectively. The maximum Call unwinding was seen at the 25,000 strike, which shed 28.16 lakh contracts, followed by the 25,800 and 24,700 strikes, which shed 12.34 lakh and 10.95 lakh contracts, respectively.
4) Nifty Put Options Data
On the Put side, the 24,000 strike holds the maximum Put open interest (with 88.09 lakh contracts), which can act as a key support level for the Nifty. It was followed by the 24,800 strike (70.09 lakh contracts) and the 24,700 strike (69.34 lakh contracts).
The maximum Put writing was placed at the 24,800 strike, which saw an addition of 52.63 lakh contracts, followed by the 24,900 and 24,700 strikes, which added 44.43 lakh and 32.61 lakh contracts, respectively. The maximum Put unwinding was seen at the 25,400 strike, which shed 8,850 contracts, followed by the 25,450 and 25,700 strikes which shed 1,575 and 1,500 contracts, respectively.
5) Bank Nifty Call Options Data
According to the monthly options data, the maximum Call open interest was seen at the 56,000 strike, with 21.08 lakh contracts. This can act as a key resistance level for the index in the short term. It was followed by the 57,000 strike (15.27 lakh contracts) and the 58,000 strike (12.09 lakh contracts).
Maximum Call writing was visible at the 55,900 strike (with the addition of 89,460 contracts), followed by the 56,200 strike (82,230 contracts), and the 56,300 strike (62,940 contracts). The maximum Call unwinding was seen at the 55,500 strike, which shed 1.04 lakh contracts, followed by the 56,500 and 55,600 strikes, which shed 67,470 and 49,620 contracts, respectively.
6) Bank Nifty Put Options Data
On the Put side, the 56,000 strike holds the maximum Put open interest (with 19.83 lakh contracts), which can act as a key level for the index. This was followed by the 55,000 strike (13.47 lakh contracts) and the 55,500 strike (10.19 lakh contracts).
The maximum Put writing was observed at the 55,500 strike (which added 2.71 lakh contracts), followed by the 56,000 strike (1.89 lakh contracts) and the 55,900 strike (1.48 lakh contracts). The maximum Put unwinding was seen at the 54,500 strike, which shed 1.07 lakh contracts, followed by the 56,500 and 57,000 strikes, which shed 45,120 and 14,310 contracts, respectively.
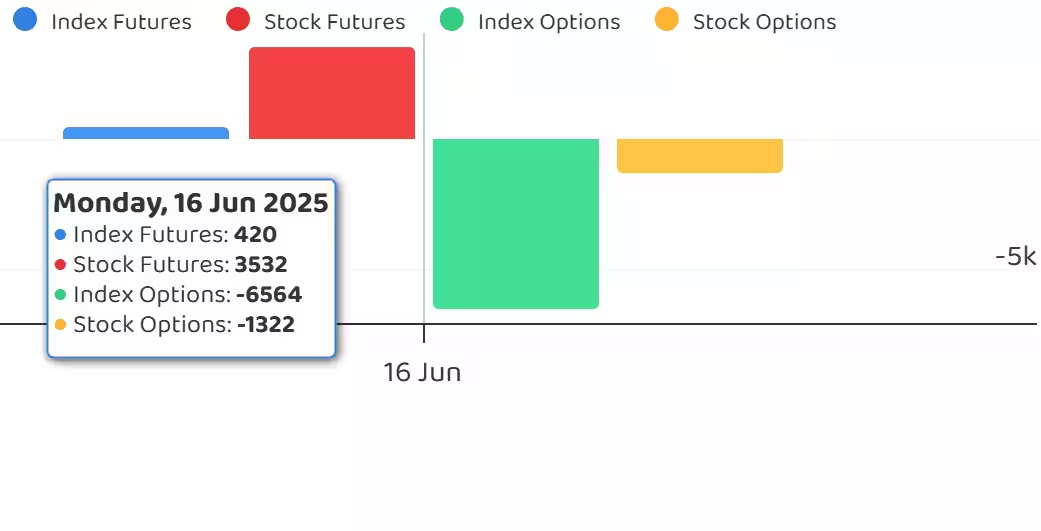
7) Funds Flow (Rs crore)
8) Put-Call Ratio
The Nifty Put-Call ratio (PCR), which indicates the mood of the market, jumped to 1.14 (the highest level since May 15) on June 16, compared to 0.89 in the previous session.
The increasing PCR, or being higher than 0.7 or surpassing 1, means traders are selling more Put options than Call options, which generally indicates the firming up of a bullish sentiment in the market. If the ratio falls below 0.7 or moves towards 0.5, then it indicates selling in Calls is higher than selling in Puts, reflecting a bearish mood in the market.
9) India VIX
The India VIX, which measures expected market volatility, dropped below the 15 mark to close at 14.84, down 1.61 percent. This decline follows an upward move in the previous couple of sessions and provides some comfort for the bulls.
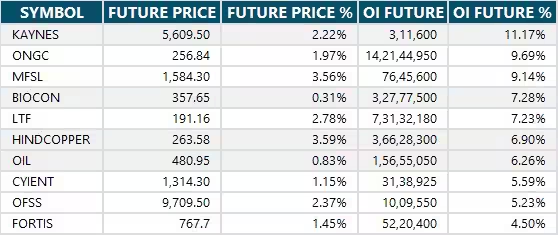
10) Long Build-up (132 Stocks)
A long build-up was seen in 132 stocks. An increase in open interest (OI) and price indicates a build-up of long positions.
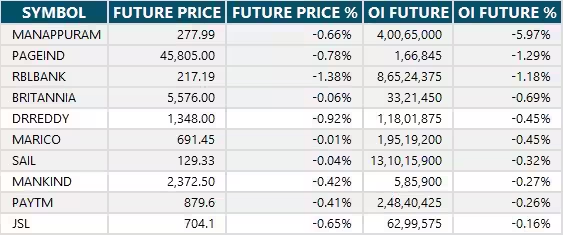
11) Long Unwinding (11 Stocks)
11 stocks saw a decline in open interest (OI) along with a fall in price, indicating long unwinding.
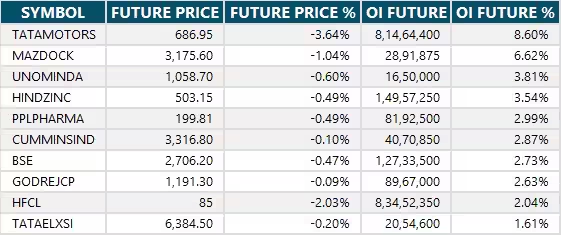
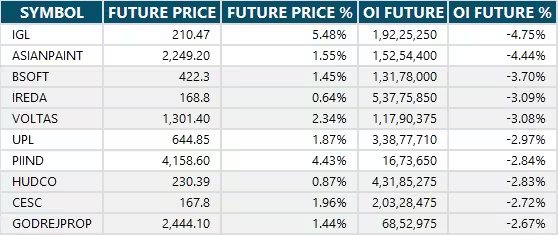
12) Short Build-up (17 Stocks)
17 stocks saw an increase in OI along with a fall in price, indicating a build-up of short positions.
13) Short-Covering (64 Stocks)
64 stocks saw short-covering, meaning a decrease in OI, along with a price increase.
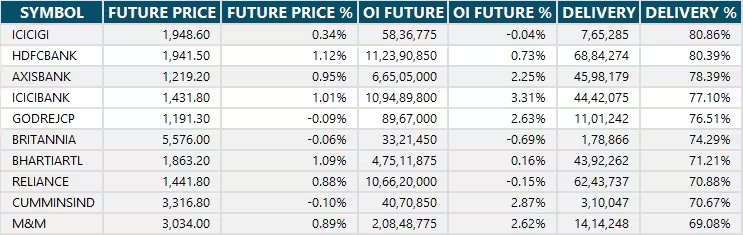
14) High Delivery Trades
Here are the stocks that saw a high share of delivery trades. A high share of delivery reflects investing (as opposed to trading) interest in a stock.
15) Stocks Under F&O Ban
Securities banned under the F&O segment include companies where derivative contracts cross 95 percent of the market-wide position limit.
Stocks added to F&O ban: Nil
Stocks retained in F&O ban: Aditya Birla Fashion and Retail, Birlasoft, Central Depository Services, Chambal Fertilisers and Chemicals, HUDCO, Indian Renewable Energy Development Agency (IREDA), Manappuram Finance, RBL Bank, Titagarh Rail Systems
Stocks removed from F&O ban: Indian Energy Exchange


0 Comment