10 Jun , 2024 By : Debdeep Gupta

Tata Steel | CMP: Rs 179
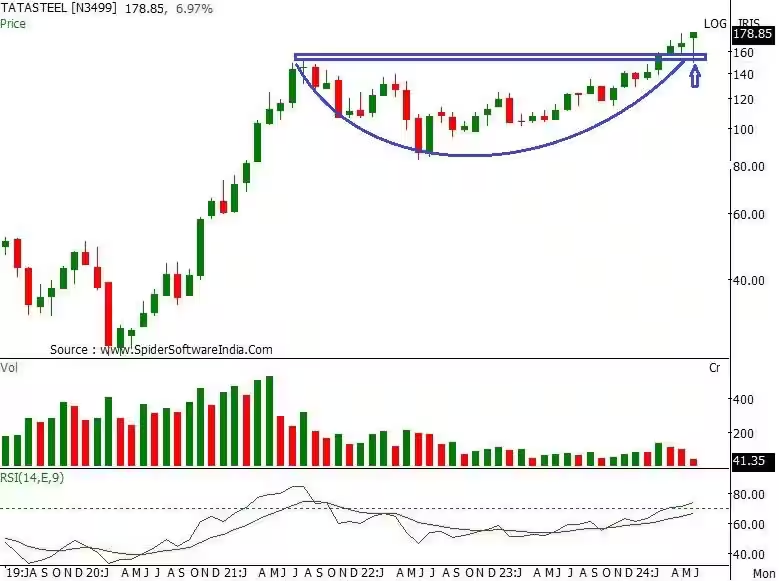
Tata Steel is in a strong uptrend across all time frames, forming a series of higher tops and bottoms, indicating positive bias. It has registered an all-time high at Rs 179.65, indicating bullish sentiments. The stock has been well placed above its 20, 50, 100, and 200-day SMA, and these averages are also inching up along with the price rise, reaffirming the bullish trend. The daily, weekly, and monthly strength indicator Relative Strength Index (RSI) is in positive terrain, which justifies rising strength across all time frames. The monthly "Bollinger band" buy signal shows increased momentum.
Investors should buy, hold, and accumulate this stock with an expected upside of Rs 200-221, with a downside support zone of Rs 170-162 levels.
Strategy: Buy
Target: Rs 200, 221
Stop-Loss: Rs 162
Biocon | CMP: Rs 336
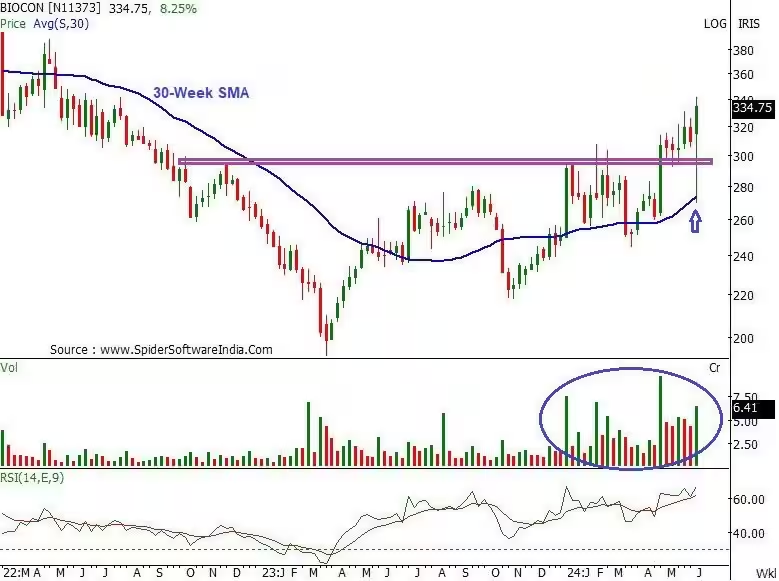
Biocon continues to trend higher on the daily and weekly time frames, forming a series of higher tops and bottoms. Recently, the stock has recuperated its 100 and 200-day SMA and rebounded sharply. This support zone also coincides with the 30-week SMA (Simple Moving Average) support zone of Rs 274, which remains a crucial support zone. Rising volumes over the past 5-6 months signify increased participation in every rally. The daily and weekly "Bollinger band" buy signal shows increased momentum. The daily, weekly, and monthly strength indicator RSI is in positive terrain, which justifies rising strength across all time frames.
Investors should buy, hold, and accumulate this stock with an expected upside of Rs 365-400, with a downside support zone of Rs 310-290 levels.
Strategy: Buy
Target: Rs 365, 400
Stop-Loss: Rs 290
Pidilite Industries | CMP: Rs 3124
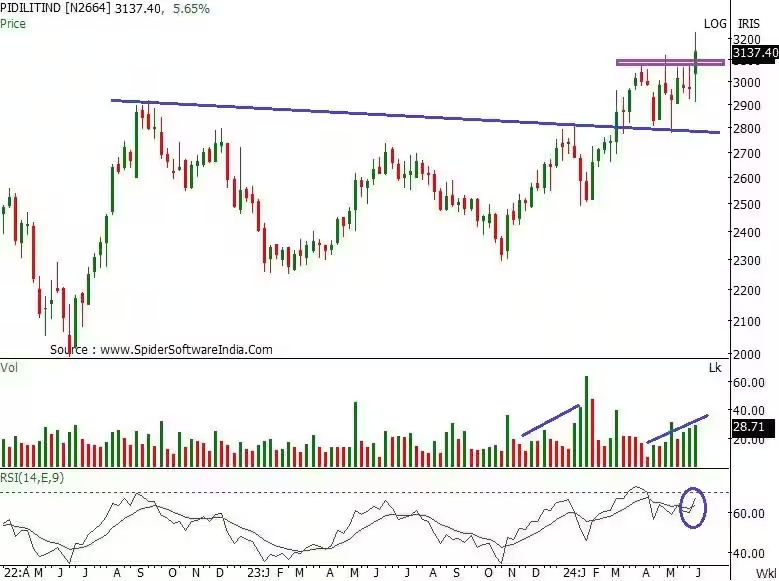
Pidilite is in a strong uptrend across all time frames, forming a series of higher tops and bottoms, indicating positive bias. It has registered an all-time high at Rs 3,231, indicating bullish sentiments. With last week's gains of 5 per cent, it has decisively broken out of the "multiple resistance" zone of Rs 3,100 levels along with huge volumes, indicating increased momentum. The stock has recaptured its 20 and 50-day SMA and rebounded sharply, which reconfirms the bullish trend. The daily, weekly, and monthly strength indicator RSI is in positive terrain, which justifies rising strength across all time frames.
Investors should buy, hold, and accumulate this stock with an expected upside of Rs 3,280-3,420, with a downside support zone of Rs 3,080-3,000 levels.
Strategy: Buy
Target: Rs 3,280, 3,420
Stop-Loss: Rs 3,000
Osho Krishan, Senior Analyst - Technical & Derivative Research at Angel One
Apollo Tyres | CMP: Rs 485

Apollo Tyres has seen a decent correction in the last couple of trading months, plunging towards the 200 SMA on the daily chart. However, in the last couple of sessions, the counter has restored some strength from its historical support and the neckline of the previous breakout and seems to recoup from here on. Additionally, the 14-period RSI has witnessed a positive crossover as the counter surpassed all its major EMAs on the daily chart, construing a positive development.
Hence, we recommend buying Apollo Tyres around Rs 480-470, with a stop-loss of Rs 445 and a target at Rs 520-540.
Strategy: Buy
Target: Rs 520, 540
Stop-Loss: Rs 445
Prince Pipes & Fittings | CMP: Rs 650.40
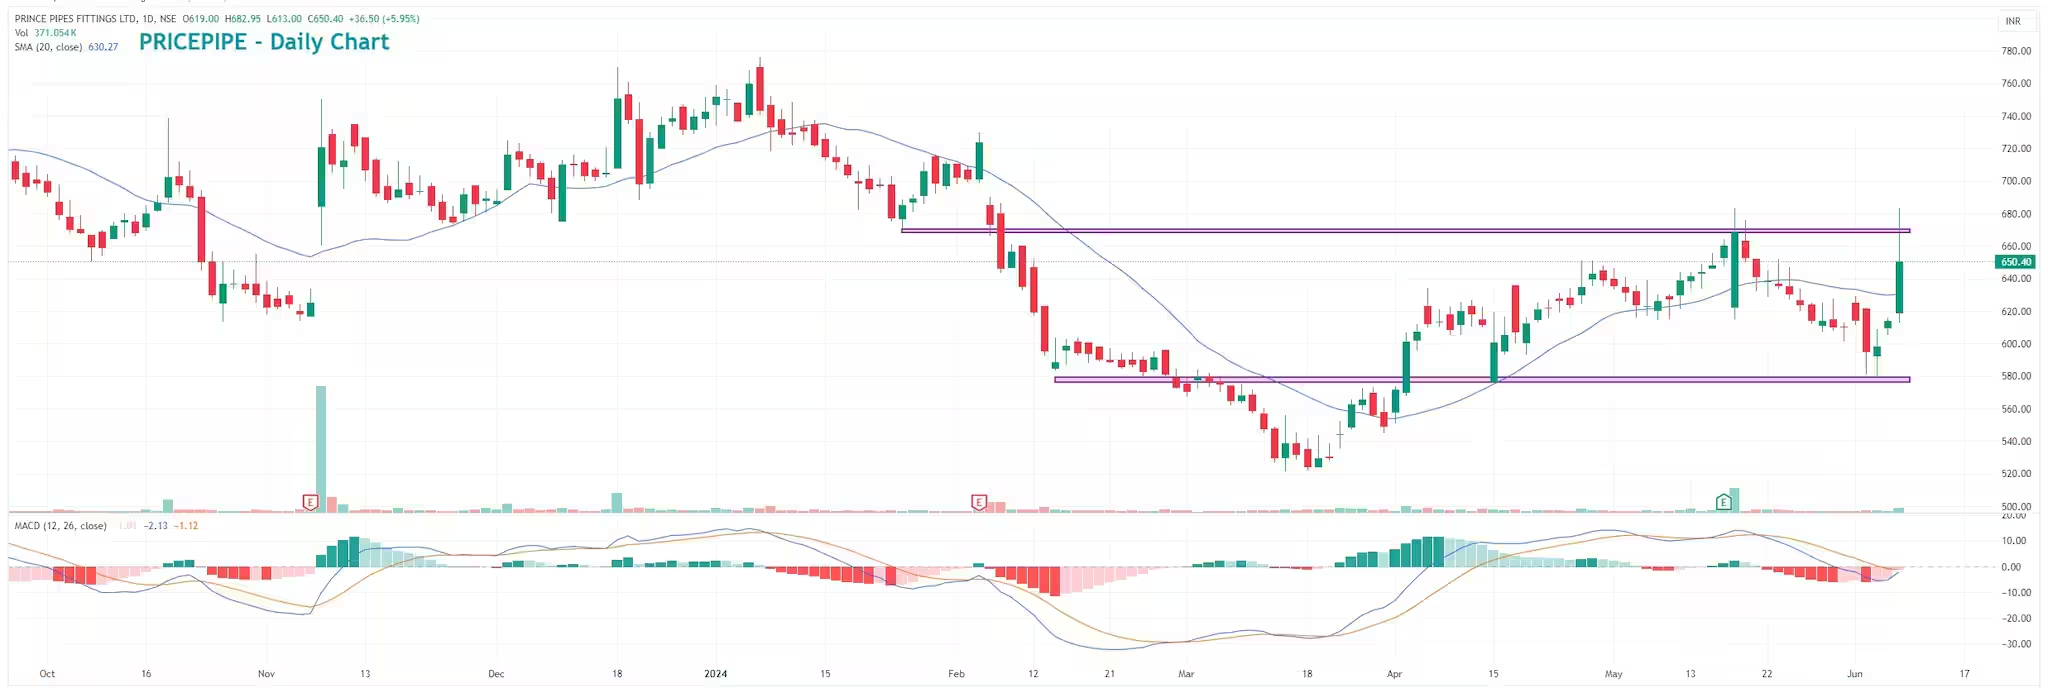
Prince Pipes witnessed a decisive spurt in price volume in the last trading session, soaring nearly 6 per cent. The counter has witnessed very strong traction from the cluster of its short-term moving averages and is now on the verge of a ‘Cup & Handle’ pattern breakout, after which strong momentum is likely to be seen in the counter. On the oscillator front, the 14-period RSI signals a continuation move, suggesting a potential upside journey in a comparable period.
Hence, we recommend buying Prince Pipes for around Rs 640, with a stop-loss of Rs 580 and a target of Rs 740-750.
Strategy: Buy
Target: Rs 740, 750
Stop-Loss: Rs 580
Wipro | CMP: Rs 484.55
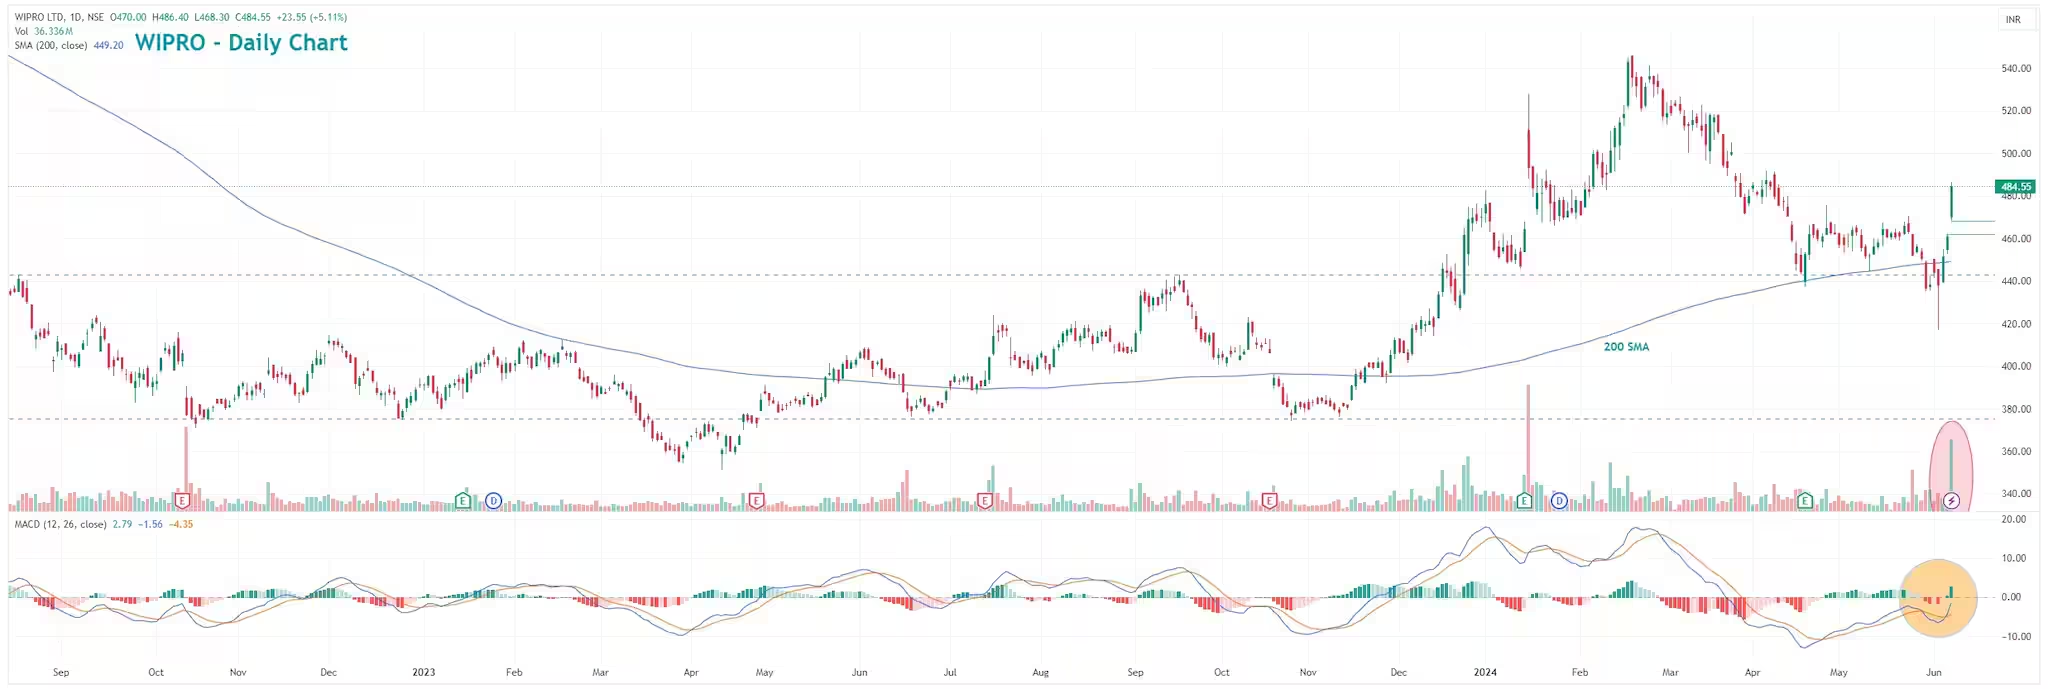
Wipro has seen a strong resurgence after the substantial consolidation seen in the last couple of trading weeks near its key support of 200 SMA. Furthermore, the market has experienced a notable increase in buying activity, with trading volumes surpassing all major EMAs, indicating a strong bullish sentiment. As a result, it is now positioned for a gradual reversal shortly. On the oscillator front, the 14-period RSI and MACD both signal a reversal from the oversold terrain, suggesting a potential upside journey in a comparable period.
Hence, we recommend buying Wipro for around Rs 480-470, with a stop-loss of Rs 440 and a target of Rs 540-550.
Strategy: Buy
Target: Rs 540-550
Stop-Loss: Rs 440
Nandish Shah, Senior Technical/Derivative Analyst at HDFC Securities
Deepak Fertilisers And Petrochemicals Corporation | CMP: Rs 579
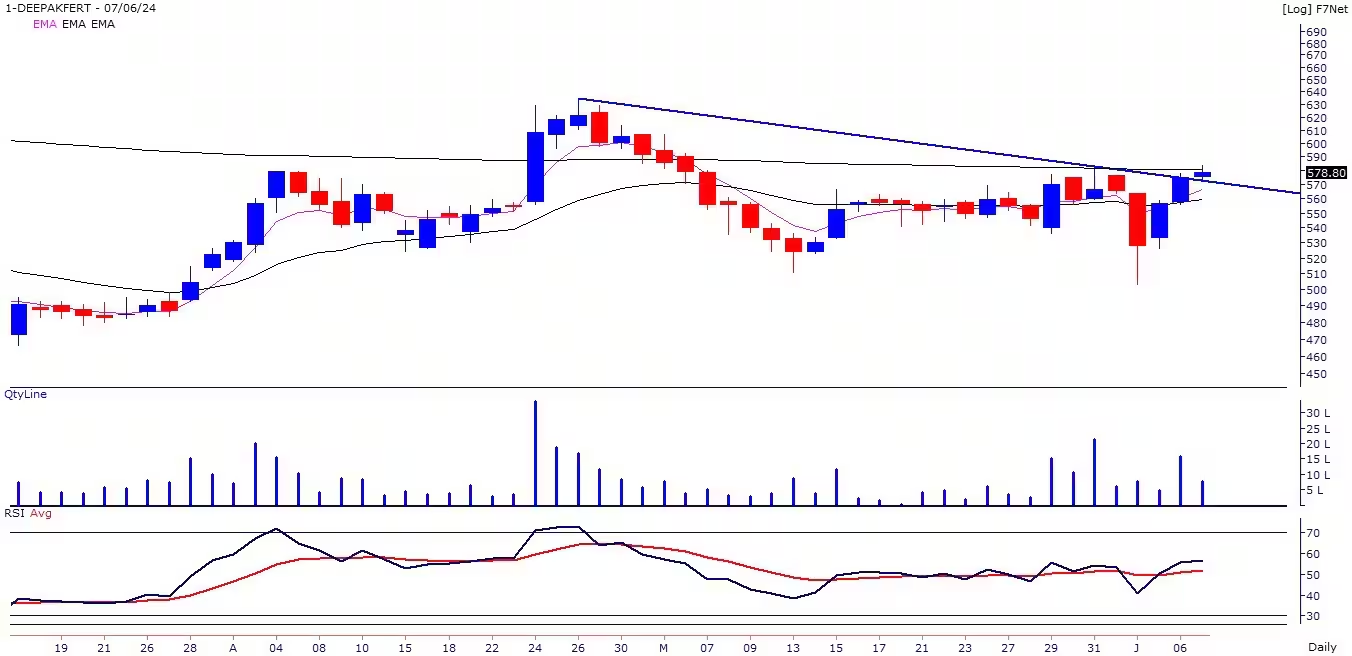
The short-term trend of Deepak Fertilisers turned positive as it has closed above its 5, 11, and 20-day EMA. Accumulation has been seen in the stock during the last few weeks, where volumes were higher on up days compared to down days. Momentum indicators and oscillators like MFI (Money Flow Index) and RSI are sloping upwards and placed above 60 on the weekly chart, suggesting strength in the current bullish trend. The stock price is likely to show momentum once it surpasses the 200-day EMA, placed at Rs 581.
Strategy: Buy
Target: Rs 625, 655
Stop-Loss: Rs 540
Nuvoco Vistas Corporation | CMP: Rs 335
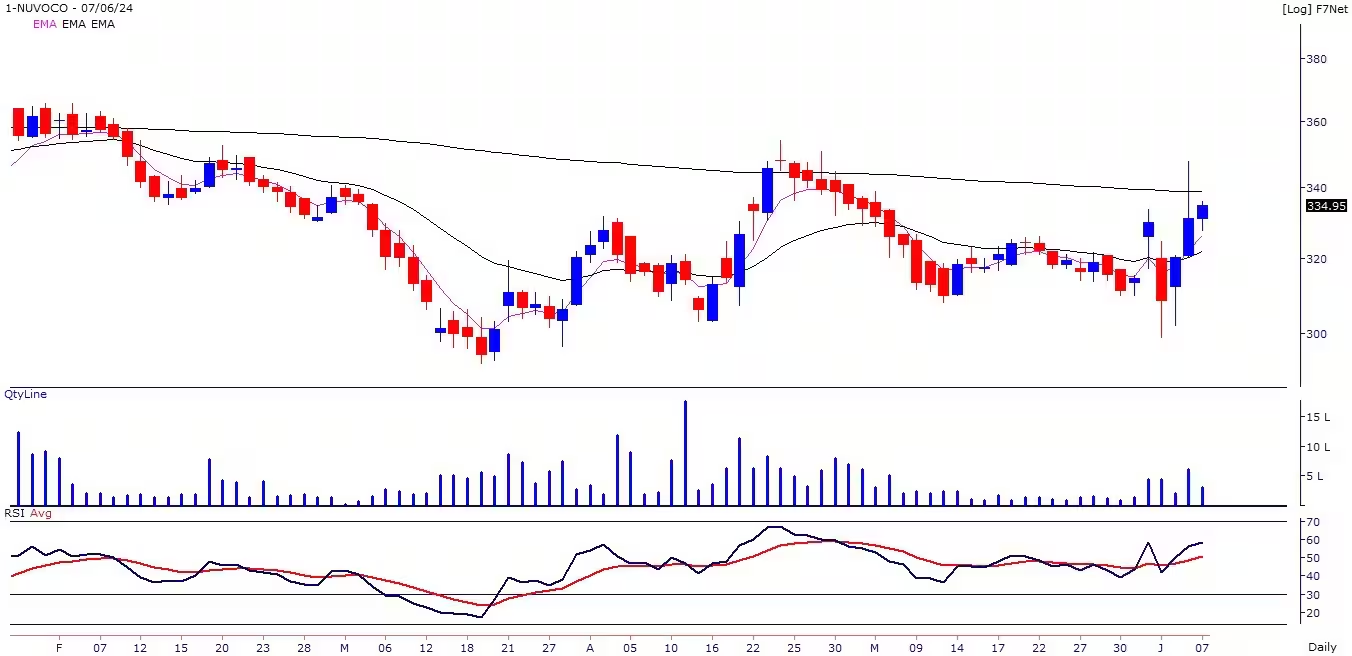
After forming multiple bottoms around 310 odd levels, Nuvoco Vistas stock price reversed northwards to close at a one-month high. Accumulation has been seen during the last four days, where the price rise is accompanied by rising volumes. The short-term trend of the stock turned positive as it closed above its important moving averages. Cement stocks have regained momentum and that is expected to continue.
Strategy: Buy
Target: Rs 355, 370
Stop-Loss: Rs 310
Rallis India | CMP: Rs 282
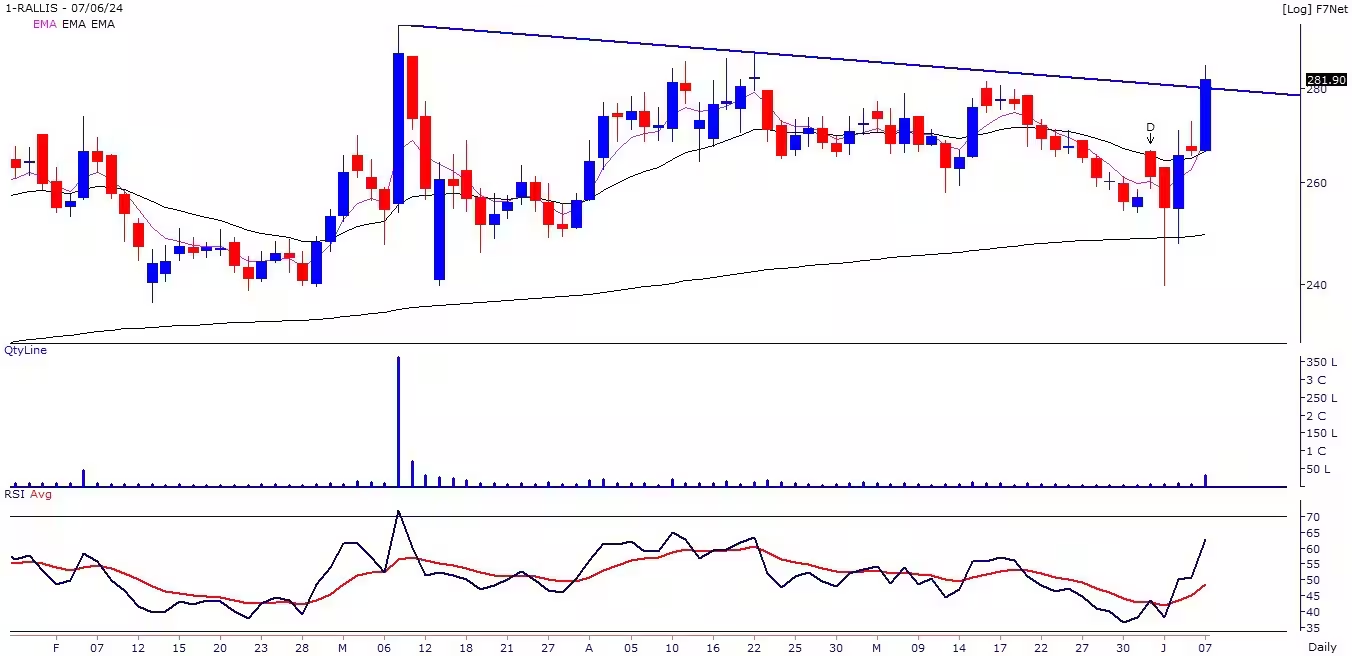
Rallis India stock price has broken out on the daily chart from the downward sloping trendline with higher volumes to close at the highest level since April 22, 2024. The primary trend of the stock is positive as it is placed above its important long-term moving averages. Momentum Indicators and Oscillators like MFI and RSI are in rising mode and placed above 60 levels, suggesting strength in the current upmove.
Strategy: Buy
Target: Rs 299, 310
Stop-Loss: Rs 267
0 Comment