03 Sep , 2025 By : Debdeep Gupta

The Nifty 50 failed to hold on to follow-up buying and sustain above the midline of the Bollinger Bands, shedding 176 points from the day's high and finishing 0.2 percent lower on September 2. While the trend showed slight improvement after the previous day's rally, rangebound trading is expected to continue in the upcoming sessions until the index climbs back above all key moving averages. The 24,400 is likely to serve as immediate support, with the 24,300–24,250 zone considered a crucial support area. On the higher side, the 24,700–24,800 zone is expected to act as immediate resistance for the benchmark index, followed by 25,000 as a crucial hurdle, according to experts.
Here are 15 data points we have collated to help you spot profitable trades:
1) Key Levels For The Nifty 50 (24,580)
Resistance based on pivot points: 24,709, 24,764, and 24,853
Support based on pivot points: 24,530, 24,475, and 24,386
Special Formation: The Nifty 50 formed a bearish candle with a long upper shadow and a minor lower shadow on the daily timeframe, indicating selling pressure at higher levels (24,700–24,750). Despite the weakness, the higher high–higher low structure was sustained. However, the index could not hold above the 20-day EMA, 100-day EMA, or the midline of the Bollinger Bands on a closing basis. The Relative Strength Index (RSI) stood at 44.36, remained sideways, and retained a negative crossover. The Moving Average Convergence Divergence (MACD) continued to show a bearish crossover with a weakening histogram. This indicates ongoing weakness and lack of strong momentum, despite structural resilience.
2) Key Levels For The Bank Nifty (53,661)
Resistance based on pivot points: 54,023, 54,160, and 54,383
Support based on pivot points: 53,577, 53,440, and 53,217
Resistance based on Fibonacci retracement: 54,534, 55,128
Support based on Fibonacci retracement: 53,417, 52,422
Special Formation: The Bank Nifty tested its 200-day EMA intraday and formed a long bearish candle on the daily chart, almost engulfing the previous day's green candle. The index managed to defend its upward sloping support trendline on a closing basis for another session and also held above the 50% Fibonacci retracement level (53,417) — measured from the April low to July high. However, technical indicators reflect growing weakness. The 20-day EMA has already fallen below the 50-day EMA, and is now on the verge of declining below the 100-day EMA — a bearish signal. The RSI stood at 30.72, indicating oversold conditions but continued weakness. The MACD maintained a bearish crossover, with persistent weakness in the histogram. This indicates prevailing negative momentum and potential for further downside unless key supports hold.
3) Nifty Call Options Data
According to the weekly options data, the maximum Call open interest was seen at the 25,000 strike (with 58.26 lakh contracts). This level can act as a key resistance for the Nifty in the short term. It was followed by the 24,800 strike (43.87 lakh contracts), and the 24,700 strike (42.65 lakh contracts).
Maximum Call writing was observed at the 25,000 strike, which saw an addition of 27.31 lakh contracts, followed by the 24,800 and 24,700 strikes, which added 25.91 lakh and 21.21 lakh contracts, respectively. There was hardly any Call unwinding seen in the 23,950-25,400 strike band.
4) Nifty Put Options Data
On the Put side, the 24,500 strike holds the maximum Put open interest (with 49.95 lakh contracts), which can act as a key support level for the Nifty. It was followed by the 24,000 strike (43.46 lakh contracts) and the 24,600 strike (34.1 lakh contracts).
The maximum Put writing was placed at the 24,500 strike, which saw an addition of 21.56 lakh contracts, followed by the 24,600 and 24,800 strikes, which added 16.15 lakh and 21.35 lakh contracts, respectively. There was hardly any Put unwinding seen in the 23,950-25,400 strike band.
5) Bank Nifty Call Options Data
According to the monthly options data, the 56,000 strike holds the maximum Call open interest, with 13.21 lakh contracts. This can act as a key resistance level for the index in the short term. It was followed by the 55,000 strike (13.11 lakh contracts) and the 54,000 strike (11.85 lakh contracts).
Maximum Call writing was observed at the 54,000 strike (with the addition of 2.84 lakh contracts), followed by the 55,000 strike (1.73 lakh contracts), and the 54,500 strike (96,530 contracts). There was hardly any Call unwinding seen in the 52,100-56,000 strike band.
6) Bank Nifty Put Options Data
On the Put side, the maximum Put open interest was seen at the 54,000 strike (with 12.78 lakh contracts), which can act as a key level for the index. This was followed by the 53,000 strike (8.65 lakh contracts) and the 55,000 strike (7.08 lakh contracts).
The maximum Put writing was observed at the 53,000 strike (which added 66,920 contracts), followed by the 52,500 strike (64,035 contracts) and the 54,100 strike (52,115 contracts). The maximum Put winding was seen at the 53,800 strike, which shed 18,655 contracts, followed by the 55,000 and 54,900 strikes, which shed 16,975 and 6,265 contracts, respectively.
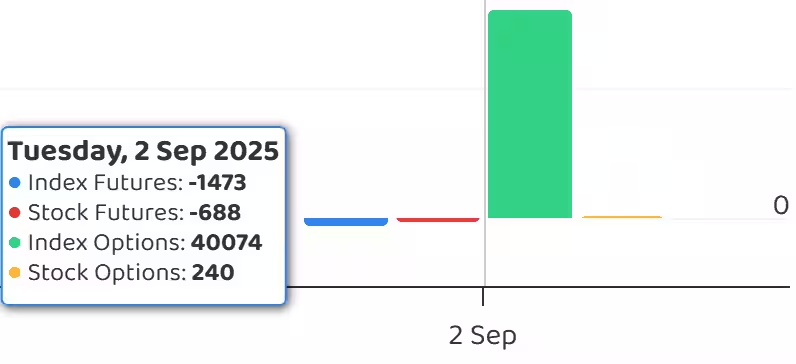
7) Funds Flow (Rs crore)
8) Put-Call Ratio
The Nifty Put-Call ratio (PCR), which indicates the mood of the market, fell to 0.99 on September 02, compared to 1.14 in the previous session.
The increasing PCR, or being higher than 0.7 or surpassing 1, means traders are selling more Put options than Call options, which generally indicates the firming up of a bullish sentiment in the market. If the ratio falls below 0.7 or moves towards 0.5, then it indicates selling in Calls is higher than selling in Puts, reflecting a bearish mood in the market.
9) India VIX
The India VIX, known as the market’s fear gauge, rose 0.95 percent to 11.4, but still remained in the lower zone. While this reflects stability in the market, it also serves as a cautionary signal, suggesting the possibility of a sharp move in either direction.
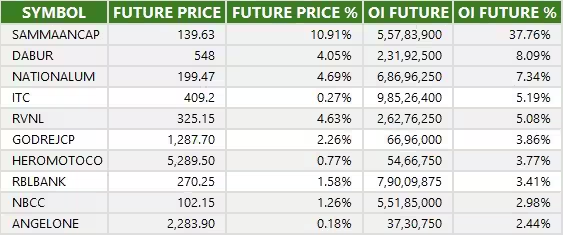
10) Long Build-up (43 Stocks)
A long build-up was seen in 43 stocks. An increase in open interest (OI) and price indicates a build-up of long positions.
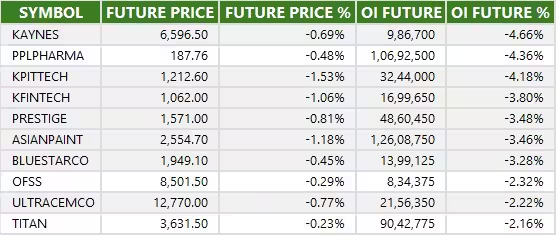
11) Long Unwinding (38 Stocks)
38 stocks saw a decline in open interest (OI) along with a fall in price, indicating long unwinding.
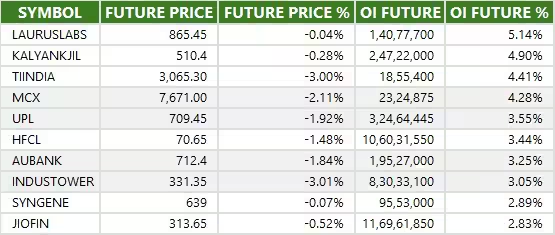
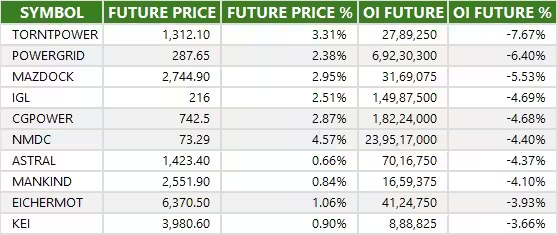
12) Short Build-up (59 Stocks)
59 stocks saw an increase in OI along with a fall in price, indicating a build-up of short positions.
13) Short-Covering (73 Stocks)
73 stocks saw short-covering, meaning a decrease in OI, along with a price increase.
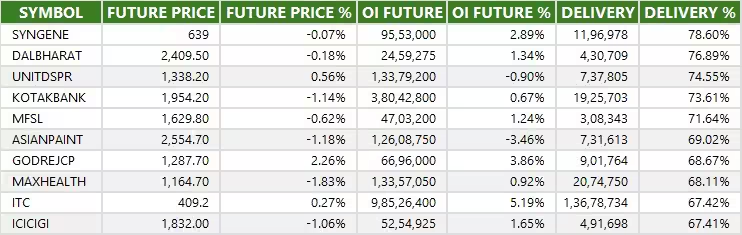
14) High Delivery Trades
Here are the stocks that saw a high share of delivery trades. A high share of delivery reflects investing (as opposed to trading) interest in a stock.
15) Stocks Under F&O Ban
Securities banned under the F&O segment include companies where derivative contracts cross 95 percent of the market-wide position limit.
Stocks added to F&O ban: Nil
Stocks retained in F&O ban: Nil
Stocks removed from F&O ban: Nil


0 Comment