10 Feb , 2025 By : Debdeep Gupta

The Nifty 50 remained under pressure for the third consecutive session on February 7, losing 43 points amid volatility after the 25 bps rate cut by the RBI, which was in line with expectations. The continuation of lower tops-lower bottoms formation and the index falling below the 200-day EMA (23,620) made the short-term trend weak. Hence, if the index fails to defend the 23,500-23,400 support zone, selling pressure may extend with the negation of the higher highs-higher lows formation. However, holding above this level could take the index toward 23,800, the key resistance area, in the upcoming sessions, experts said.
Here are 15 data points we have collated to help you spot profitable trades:
1) Key Levels For The Nifty 50 (23,560)
Resistance based on pivot points: 23,662, 23,721, and 23,817
Support based on pivot points: 23,470, 23,411, and 23,315
Special Formation: The Nifty 50 formed a bearish candlestick pattern with a minor upper shadow and long lower shadow on the daily charts, falling below the 50 and 200-day EMAs (Exponential Moving Averages) with above-average volumes, signaling a negative trend. However, the index still held above the 10 and 20-day EMAs as well as the midline of the Bollinger bands, which serve as the key support zone. During the week, it gained 0.33 percent and formed a bullish candle with a higher high-higher low formation while still holding above the 50-week EMA, although there was selling pressure at higher levels.
2) Key Levels For The Bank Nifty (50,159)
Resistance based on pivot points: 50,518, 50,700, and 50,995
Support based on pivot points: 49,930, 49,748, and 49,453
Resistance based on Fibonacci retracement: 50,381, 51,162
Support based on Fibonacci retracement: 47,875, 46,078
Special Formation: The Bank Nifty managed to defend the 50 and 200-day EMAs in the previous two sessions, but on Friday, it could not sustain above both EMAs, forming a bearish candlestick pattern with a long upper wick and minor upper shadows on the daily timeframe with above-average volumes, indicating minor weakness. However, the trend still seems to be positive as the index sustained well above the 10 and 20-day EMAs as well as the midline of the Bollinger bands. It fell 0.44 percent on Friday, but for the week, it was up 1.32 percent, forming a bullish candle with a higher high-higher low formation on the weekly charts.
3) Nifty Call Options Data
According to the weekly options data, the maximum Call open interest was seen at the 24,000 strike (with 84.13 lakh contracts). This level can act as a key resistance for the Nifty in the short term. It was followed by the 24,500 strike (82.92 lakh contracts) and the 23,800 strike (65.74 lakh contracts).
Maximum Call writing was observed at the 24,000 strike, which saw an addition of 36.16 lakh contracts, followed by the 23,800 and 24,500 strikes, which added 33.62 lakh and 33.37 lakh contracts, respectively. The maximum Call unwinding was seen at the 23,000 strike which shed 1.67 lakh contracts, followed by the 22,800 and 23,200 strikes which shed 12,225 and 7,725 contracts, respectively.
4) Nifty Put Options Data
On the Put side, the 22,600 strike holds the maximum Put open interest (with 45.66 lakh contracts), which can act as a key support level for the Nifty. It was followed by the 23,000 strike (41.36 lakh contracts) and the 23,200 strike (39.6 lakh contracts).
The maximum Put writing was placed at the 23,200 strike, which saw an addition of 25.77 lakh contracts, followed by the 22,800 and 22,700 strikes, which added 18.09 lakh and 17.11 lakh contracts, respectively. The maximum Put unwinding was seen at the 23,700 strike, which shed 5.3 lakh contracts, followed by the 23,800 and 23,650 strikes, which shed 3.88 lakh and 1.38 lakh contracts, respectively.
5) Bank Nifty Call Options Data
According to the monthly options data, the 52,000 strike holds the maximum Call open interest, with 18.66 lakh contracts. This can act as a key resistance level for the index in the short term. It was followed by the 51,000 strike (12.77 lakh contracts) and the 50,500 strike (8.39 lakh contracts).
Maximum Call writing was visible at the 51,000 strike (with the addition of 2.36 lakh contracts), followed by the 50,500 strike (1.7 lakh contracts) and the 50,200 strike (1.04 lakh contracts). The maximum Call unwinding was seen at the 49,500 strike, which shed 30,810 contracts, followed by the 49,600 and 50,000 strikes, which shed 29,190 and 26,460 contracts, respectively.
6) Bank Nifty Put Options Data
On the Put side, the maximum Put open interest was seen at the 49,000 strike (with 14 lakh contracts), which can act as a key support level for the index. This was followed by the 50,000 strike (10.55 lakh contracts) and the 48,500 strike (8.11 lakh contracts).
The maximum Put writing was observed at the 51,300 strike (which added 96,960 contracts), followed by the 50,500 strike (50,580 contracts) and the 49,900 strike (25,380 contracts). The maximum Put unwinding was seen at the 49,500 strike, which shed 78,240 contracts, followed by the 50,200 and 48,500 strikes which shed 43,080 and 36,930 contracts, respectively.
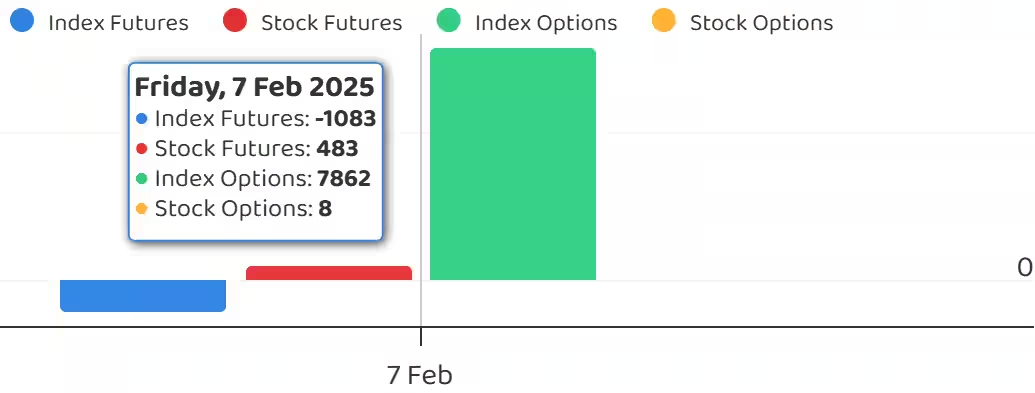
7) Funds Flow (Rs crore)
8) Put-Call Ratio
The Nifty Put-Call ratio (PCR), which indicates the mood of the market, declined to 0.83 on February 7, against 0.95 in the previous session.
The increasing PCR, or being higher than 0.7 or surpassing 1, means traders are selling more Put options than Call options, which generally indicates the firming up of a bullish sentiment in the market. If the ratio falls below 0.7 or moves towards 0.5, then it indicates selling in Calls is higher than selling in Puts, reflecting a bearish mood in the market.
9) India VIX
The India VIX, the fear gauge that measures expected market volatility, remained in a lower zone, continuing to keep the bulls in a comfort zone. It declined 3.46 percent to 13.69 on Friday, sustaining well below all key moving averages.
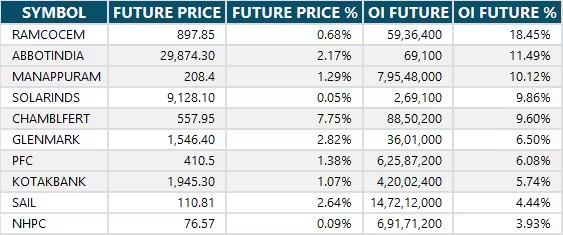
10) Long Build-up (52 Stocks)
A long build-up was seen in 52 stocks. An increase in open interest (OI) and price indicates a build-up of long positions.
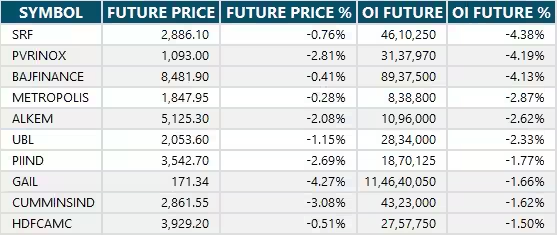
11) Long Unwinding (45 Stocks)
45 stocks saw a decline in open interest (OI) along with a fall in price, indicating long unwinding.
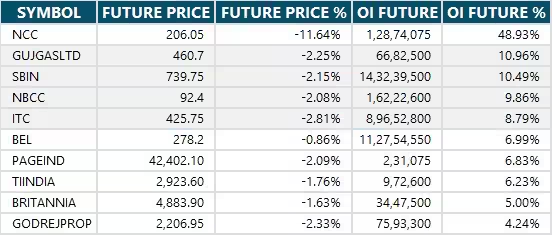
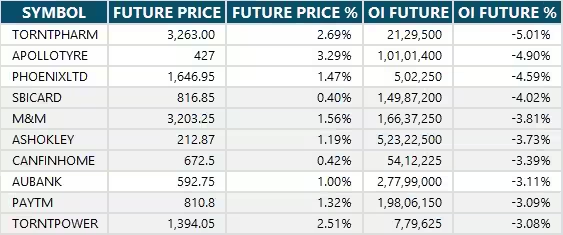
12) Short Build-up (70 Stocks)
70 stocks saw an increase in OI along with a fall in price, indicating a build-up of short positions.
13) Short-Covering (63 Stocks)
63 stocks saw short-covering, meaning a decrease in OI, along with a price increase.
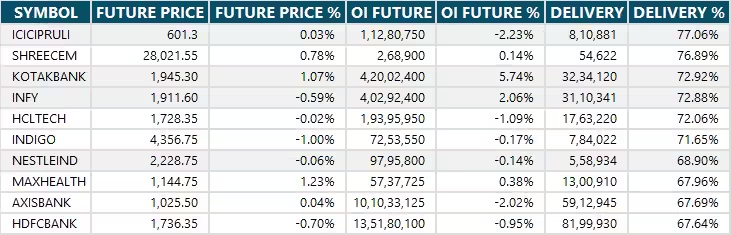
14) High Delivery Trades
Here are the stocks that saw a high share of delivery trades. A high share of delivery reflects investing (as opposed to trading) interest in a stock.
15) Stocks Under F&O Ban
Securities banned under the F&O segment include companies where derivative contracts cross 95 percent of the market-wide position limit.
Stocks added to F&O ban: Manappuram Finance
Stocks retained in F&O ban: Nil
Stocks removed from F&O ban: Nil


0 Comment