24 Mar , 2025 By : Debdeep Gupta

The Nifty 50 soared to a six-week high due to a stupendous rally throughout the week, rising 0.7 percent on March 21 and 4.26 percent for the week (the biggest weekly gain since the first week of February 2021). This was tracked by a consistent decline in the India VIX, which reached a more than 24-week low. All sectors participated in the rally. Hence, experts believe that the 23,400-23,500 range is expected to be an immediate resistance zone, as a decisive close above it could open doors to 23,800, the key hurdle (February swing low). However, in the event of consolidation, the 23,100-23,000 range is likely to act as the support zone, as a fall below this level could bring bears into action.
Here are 15 data points we have collated to help you spot profitable trades:
1) Key Levels For The Nifty 50 (23,350)
Resistance based on pivot points: 23,398, 23,462, and 23,565
Support based on pivot points: 23,192, 23,128, and 23,025
Special Formation: The Nifty 50 formed a long bullish candle on the daily charts, continuing the higher highs-higher lows formation for the fourth consecutive session. The volume was well above average. The index continued to trade above the upper line of the Bollinger Bands and the 50-day EMA, with all short- and medium-term moving averages trending upward. Momentum indicators also provided positive signals, with the RSI (Relative Strength Index) climbing to 66.29 and the MACD (Moving Average Convergence Divergence) moving into the above-zero line zone. For the week, the index rallied 4.26 percent and recorded a robust bullish candle on the weekly scale, signaling a strong trend ahead.
2) Key Levels For The Bank Nifty (50,594)
Resistance based on pivot points: 50,684, 50,868, and 51,166
Support based on pivot points: 50,088, 49,904, and 49,606
Resistance based on Fibonacci retracement: 51,085, 51,883
Support based on Fibonacci retracement: 50,273, 49,283
Special Formation: The Bank Nifty recorded a long bullish candle on both the daily and weekly charts, signaling healthy momentum ahead. The index sustained its upward journey and maintained a higher tops-higher bottoms formation for the seventh consecutive session. It rose 1 percent on Friday with above-average volumes and rallied 5.27 percent for the week. The RSI at 68.39 has been trending upward, and the MACD remained above the zero line with a positive bias on the daily charts.
3) Nifty Call Options Data
According to the monthly options data, the maximum Call open interest was seen at the 24,000 strike (with 1.17 crore contracts). This level can act as a key resistance for the Nifty in the short term. It was followed by the 24,100 strike (95.94 lakh contracts), and the 23,600 strike (84.2 lakh contracts).
Maximum Call writing was observed at the 24,100 strike, which saw an addition of 54.17 lakh contracts, followed by the 23,600 and 24,200 strikes, which added 52.83 lakh and 37.39 lakh contracts, respectively. The maximum Call unwinding was seen at the 23,200 strike, which shed 12.49 lakh contracts, followed by the 23,900 and 23,000 strikes, which shed 11.65 lakh and 8.56 lakh contracts, respectively.
4) Nifty Put Options Data
On the Put side, the 23,000 strike holds the maximum Put open interest (with 1.29 crore contracts), which can act as a key support level for the Nifty. It was followed by the 22,500 strike (1.12 crore contracts) and the 23,200 strike (71.07 lakh contracts).
The maximum Put writing was placed at the 23,000 strike, which saw an addition of 36.49 lakh contracts, followed by the 23,300 and 23,100 strikes, which added 34.23 lakh and 25.77 lakh contracts, respectively. The maximum Put unwinding was seen at the 22,800 strike, which shed 9.58 lakh contracts, followed by the 24,200 and 24,100 strikes, which shed 27,675 and 1,125 contracts, respectively.
5) Bank Nifty Call Options Data
According to the monthly options data, the 52,000 strike holds the maximum Call open interest, with 17.75 lakh contracts. This can act as a key resistance level for the index in the short term. It was followed by the 51,000 strike (12.39 lakh contracts) and the 51,500 strike (10.45 lakh contracts).
Maximum Call writing was visible at the 50,600 strike (with the addition of 1.93 lakh contracts), followed by the 52,000 strike (1.29 lakh contracts) and the 51,200 strike (1.17 lakh contracts). The maximum Call unwinding was seen at the 50,000 strike, which shed 3.62 lakh contracts, followed by the 50,100 and 49,500 strikes, which shed 2.69 lakh and 2.47 lakh contracts, respectively.
6) Bank Nifty Put Options Data
On the Put side, the maximum Put open interest was seen at the 49,000 strike (with 25.42 lakh contracts), which can act as a key support level for the index. This was followed by the 48,500 strike (16.14 lakh contracts) and the 50,000 strike (15.37 lakh contracts).
The maximum Put writing was observed at the 50,500 strike (which added 6.08 lakh contracts), followed by the 49,000 strike (3.49 lakh contracts) and the 50,400 strike (3.02 lakh contracts). The maximum Put unwinding was seen at the 49,700 strike, which shed 60,990 contracts, followed by the 52,500 and 51,500 strikes which shed 18,960 and 10,680 contracts, respectively.
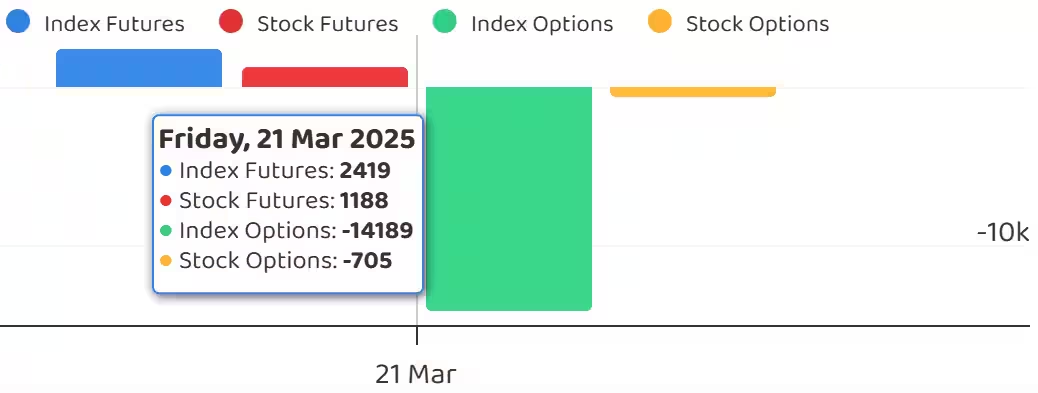
7) Funds Flow (Rs crore)
8) Put-Call Ratio
The Nifty Put-Call ratio (PCR), which indicates the mood of the market, fell to 1.15 on March 21, against 1.16 in the previous session.
The increasing PCR, or being higher than 0.7 or surpassing 1, means traders are selling more Put options than Call options, which generally indicates the firming up of a bullish sentiment in the market. If the ratio falls below 0.7 or moves towards 0.5, then it indicates selling in Calls is higher than selling in Puts, reflecting a bearish mood in the market.
9) India VIX
The India VIX, the fear gauge that measures expected market volatility, dropped to a fresh five-and-a-half-month low, declining 0.22 percent on Friday to 12.58, the lowest closing level since October 1, 2024. It has fallen consistently over the past five weeks, dropping 5.31 percent for the week.
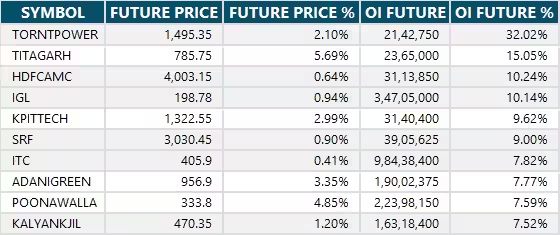
10) Long Build-up (97 Stocks)
A long build-up was seen in 97 stocks. An increase in open interest (OI) and price indicates a build-up of long positions.
11) Long Unwinding (11 Stocks)
11 stocks saw a decline in open interest (OI) along with a fall in price, indicating long unwinding.
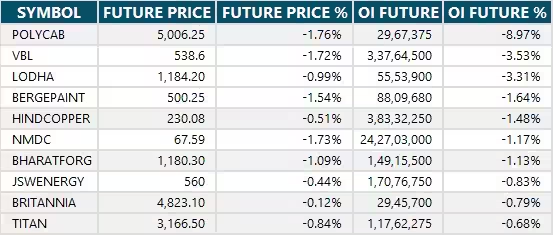
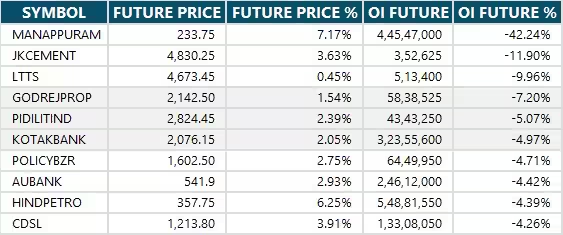
12) Short Build-up (32 Stocks)
32 stocks saw an increase in OI along with a fall in price, indicating a build-up of short positions.
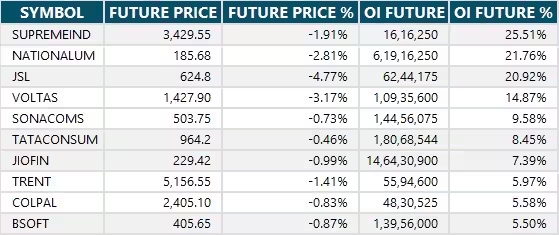
13) Short-Covering (78 Stocks)
78 stocks saw short-covering, meaning a decrease in OI, along with a price increase.
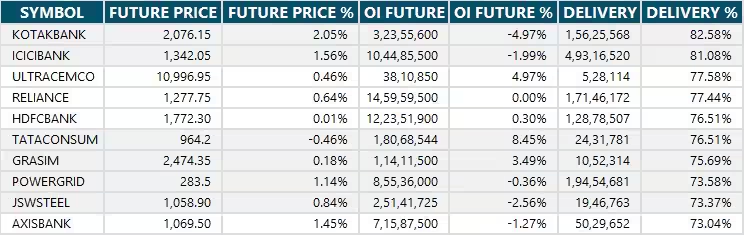
14) High Delivery Trades
Here are the stocks that saw a high share of delivery trades. A high share of delivery reflects investing (as opposed to trading) interest in a stock.
15) Stocks Under F&O Ban
Securities banned under the F&O segment include companies where derivative contracts cross 95 percent of the market-wide position limit.
Stocks added to F&O ban: Nil
Stocks retained in F&O ban: Hindustan Copper, IndusInd Bank, Polycab India
Stocks removed from F&O ban: Manappuram Finance, SAIL


0 Comment