14 Jan , 2026 By : Debdeep Gupta

The Nifty 50 gave up some of the previous day’s gains and closed 0.2 percent lower on January 13. The index negated the lower high–lower low formation of the previous five consecutive sessions, but remained below short- and medium-term moving averages along with bearish momentum indicators, indicating a cautious undertone. Consolidation is expected to continue until the index convincingly surpasses the 25,900–26,000 hurdle. Above this zone, an upward move towards 26,200–26,300 cannot be ruled out. On the downside, immediate support is placed at 25,600, followed by a crucial support at 25,450, experts said.
Here are 15 data points we have collated to help you spot profitable trades:
1) Key Levels For The Nifty 50 (25,732)
Resistance based on pivot points: 25,858, 25,928, and 26,042
Support based on pivot points: 25,632, 25,562, and 25,449
Special Formation: The Nifty 50 formed a long bearish candle with a long lower shadow on the daily chart, indicating weakness along with continued buying interest at lower levels. The index reported a higher high–higher low formation for the first time in the last six sessions. It defended the 100-day EMA for the third straight session but failed to close above the 50-day EMA, while the 10-day EMA slipped below the 20-day EMA. Short-term moving averages continued to trend downward. The RSI, at 41.16, remained below the signal line, while the MACD also stayed below the reference line with further weakness in the histogram. All this indicates a lack of clear bullish confirmation and suggests continued caution in the near term.
2) Key Levels For The Bank Nifty (59,579)
Resistance based on pivot points: 59,727, 59,834, and 60,008
Support based on pivot points: 59,379, 59,271, and 59,097
Resistance based on Fibonacci retracement: 59,837, 60,100
Support based on Fibonacci retracement: 59,368, 59,078
Special Formation: The Bank Nifty rose 0.22 percent and formed a bearish candle with a long lower shadow on the daily timeframe, indicating some weakness, though buying interest continued at lower levels for another session. The index negated the lower low structure of the previous five sessions and climbed above the 20-day EMA, sustaining above the midline of the Bollinger Bands as well as key support trendlines, which is positive. The RSI rose to 53.53 but remained below the reference line, while the MACD stayed below the signal line with weakness in the histogram. All this indicates a mixed-to-positive bias with selective buying at lower levels.
3) Nifty Call Options Data
According to the weekly options data, the 26,000 strike holds the maximum Call open interest (with 71.28 lakh contracts). This level can act as a key resistance level for the Nifty in the short term. It was followed by the 25,800 strike (56.81 lakh contracts) and 26,500 strike (45.26 lakh contracts).
Maximum Call writing was observed at the 26,000 strike, which saw an addition of 35.7 lakh contracts, followed by the 25,800 and 25,900 strikes, which added 28.93 lakh and 22.74 lakh contracts, respectively. There was hardly any Call unwinding seen in the 25,000-26,500 strike band.
4) Nifty Put Options Data
On the Put side, the maximum Put open interest was seen at the 25,000 strike (with 39.7 lakh contracts), which can act as a key support level for the Nifty in the short term. It was followed by the 25,700 strike (33.36 lakh contracts) and the 25,500 strike (32.18 lakh contracts).
The maximum Put writing was placed at the 25,000 strike, which saw an addition of 14.94 lakh contracts, followed by the 25,700 and 25,500 strikes, which added 13.16 lakh and 11.81 lakh contracts, respectively. There was hardly any Put unwinding seen in the 25,000-26,600 strike band.
5) Bank Nifty Call Options Data
According to the monthly options data, the 59,500 strike holds the maximum Call open interest, with 16.17 lakh contracts. This can act as a key level for the index in the short term. It was followed by the 60,000 strike (15.9 lakh contracts) and the 61,000 strike (7.83 lakh contracts).
Maximum Call writing was observed at the 59,800 strike (with the addition of 39,360 contracts), followed by the 60,500 strike (39,030 contracts) and 60,000 strike (38,940 contracts). The maximum Call unwinding was seen at the 59,300 strike, which shed 49,260 contracts, followed by the 59,400 and 59,500 strikes which shed 27,330 and 21,960 contracts, respectively.
6) Bank Nifty Put Options Data
On the Put side, the maximum Put open interest was seen at the 59,500 strike (with 18.84 lakh contracts), which can act as a key support level for the index. This was followed by the 59,000 strike (10.07 lakh contracts) and the 60,000 strike (7.8 lakh contracts).
The maximum Put writing was placed at the 59,600 strike (which added 40,200 contracts), followed by the 59,200 strike (35,820 contracts) and the 59,800 strike (22,950 contracts). The maximum Put unwinding was seen at the 59,100 strike, which shed 33,990 contracts, followed by the 58,700 and 60,000 strikes, which shed 31,620 and 30,510 contracts, respectively.
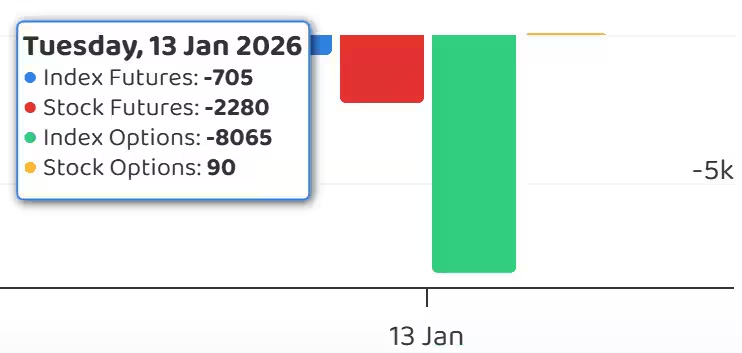
7) Funds Flow (Rs crore)
8) Put-Call Ratio
The Nifty Put-Call ratio (PCR), which indicates the mood of the market, dropped to 0.86 on January 13, compared to 0.9 in the previous session.
The increasing PCR, or being higher than 0.7 or surpassing 1, means traders are selling more Put options than Call options, which generally indicates the firming up of a bullish sentiment in the market. If the ratio falls below 0.7 or moves towards 0.5, then it indicates selling in Calls is higher than selling in Puts, reflecting a bearish mood in the market.
9) India VIX
India VIX, which measures expected market volatility, snapped its three-day gaining streak and closed at 11.2, down 1.5 percent. However, it remained at elevated levels as it once again attempted to move towards the 12 zone, signalling continued caution for bulls.
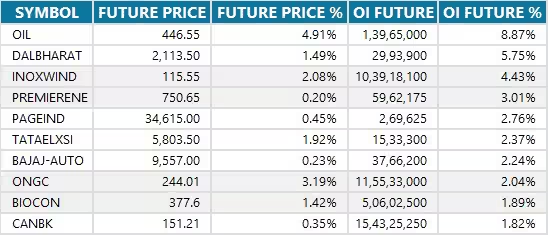
10) Long Build-up (32 Stocks)
A long build-up was seen in 32 stocks. An increase in open interest (OI) and price indicates a build-up of long positions.
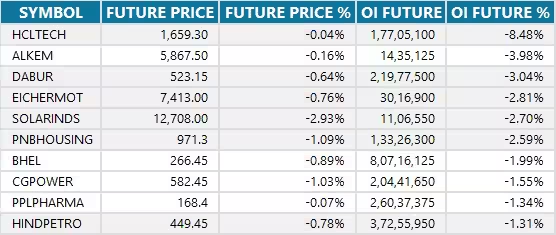
11) Long Unwinding (48 Stocks)
48 stocks saw a decline in open interest (OI) along with a fall in price, indicating long unwinding.
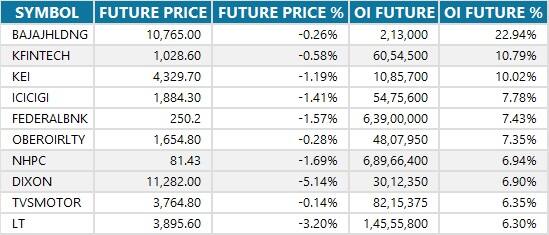
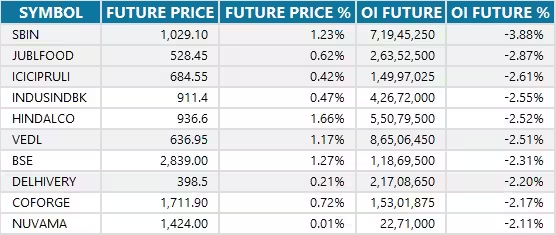
12) Short Build-up (90 Stocks)
90 stocks saw an increase in OI along with a fall in price, indicating a build-up of short positions.
13) Short-Covering (43 Stocks)
43 stocks saw short-covering, meaning a decrease in OI, along with a price increase.
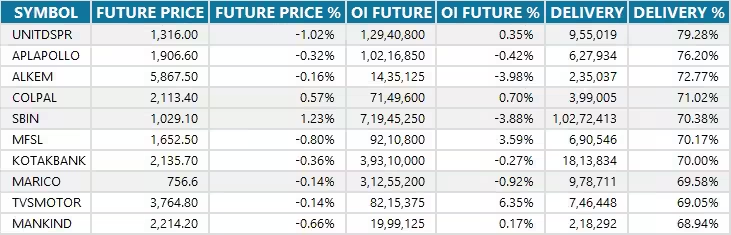
14) High Delivery Trades
Here are the stocks that saw a high share of delivery trades. A high share of delivery reflects investing (as opposed to trading) interest in a stock.
15) Stocks Under F&O Ban
Securities banned under the F&O segment include companies where derivative contracts cross 95 percent of the market-wide position limit.
Stocks added to F&O ban: Nil
Stocks retained in F&O ban: SAIL, Sammaan Capital
Stocks removed from F&O ban: Nil


0 Comment