25 Oct , 2024 By : Debdeep Gupta

Nifty Trade Setup
The market remained rangebound for another session and closed slightly below 24,400, with marginal losses on the Nifty 50 on October 24, extending its southward journey for the fourth consecutive day. Considering the formation of Inverted Hammer and Doji patterns in the last couple of days, some bounce cannot be ruled out in the upcoming sessions. However, the overall trend remains in favor of the bears; hence, experts advised continuing with a 'sell on rally' strategy. On the upside, 24,500-24,600 may serve as resistance for the index, while a break below 24,300 could drag it down sharply.
Here are 15 data points we have collated to help you spot profitable trades:
1) Key Levels For The Nifty 50
Resistance based on pivot points: 24,460, 24,493, and 24,547
Support based on pivot points: 24,354, 24,321, and 24,268
Special Formation: The Nifty 50 formed a Doji-like candlestick pattern on the daily charts, following an Inverted Hammer pattern in the previous session. This comes after a recent fall and generally indicates a potential reversal in trend. However, the lower highs and lows formation has persisted, with the index trading below the 100-day EMA (Exponential Moving Average) and the 20-week EMA. Furthermore, the momentum indicators RSI (Relative Strength Index) and MACD (Moving Average Convergence Divergence) maintain a negative crossover, indicating weakness in the short term.
2) Key Levels For The Bank Nifty
Resistance based on pivot points: 51,726, 51,863, and 52,085
Support based on pivot points: 51,283, 51,147, and 50,925
Resistance based on Fibonacci retracement: 51,823, 52,331
Support based on Fibonacci retracement: 50,687, 49,648
Special Formation: The Bank Nifty formed a bullish candlestick pattern on the daily timeframe, defending the 100-day EMA and reporting a higher high-higher low formation. However, it remains below the 20-day and 50-day EMAs, as well as the 20-day SMA (Simple Moving Average), which are crucial levels for an upward move. The index was up 292 points at 51,531 but lost 250 points from its day's high. The momentum indicator RSI showed a positive crossover on Thursday. On the weekly scale, the index fell by 1 percent and formed a bearish candlestick pattern while sustaining the higher highs-higher lows formation for another week.
3) Nifty Call Options Data
According to the weekly options data, the 24,400 strike holds the maximum open interest (with 2.46 crore contracts). This level can act as a key level for the Nifty in the short term. It was followed by the 24,500 strike (1.12 crore contracts), and the 25,000 strike (85.81 lakh contracts).
Maximum Call writing was observed at the 24,400 strike, which saw an addition of 2.29 crore contracts, followed by the 24,500 and 25,100 strikes, which added 59.48 lakh and 16.3 lakh contracts, respectively. The Call unwinding was seen at the 25,000 strike, which shed 42.95 lakh contracts, followed by the 24,800 and 24,700 strikes, which shed 26.06 lakh and 17.36 lakh contracts, respectively.
4) Nifty Put Options Data
On the Put side, the maximum open interest was seen at the 24,400 strike (with 3.15 crore contracts), which can act as a key level for the Nifty. It was followed by the 24,300 strike (70.48 lakh contracts), and the 24,000 strike (70.14 lakh contracts).
The maximum Put writing was placed at the 24,400 strike, which saw an addition of 2.6 crore contracts, followed by the 24,300, and 23,900 strikes, with 35.39 lakh, and 25.52 lakh contracts added, respectively, while the Put unwinding was seen at the 23,500 strike, which shed 14.96 lakh contracts, followed by the 24,500, and 23,600 strikes, which shed 9.95 lakh and 9.74 lakh contracts, respectively.
5) Bank Nifty Call Options Data
According to the monthly options data, the 52,500 strike holds the maximum open interest, with 23.96 lakh contracts. This can act as a key resistance level for the index in the short term. It was followed by the 52,000 strike (19.88 lakh contracts) and the 53,000 strike (19.77 lakh contracts).
Maximum Call writing was visible at the 52,500 strikes (with the addition of 11.01 lakh contracts), followed by the 53,000 strikes (4.49 lakh contracts) and the 52,000 strikes (4.21 lakh contracts), while the maximum Call unwinding was seen at the 51,200 strikes, which shed 1.45 lakh contracts, followed by the 51,400 and 51,300 strikes, which shed 85,500 and 55,095 contracts, respectively.
6) Bank Nifty Put Options Data
On the Put side, the maximum open interest was seen at the 51,000 strikes (with 20.06 lakh contracts), which can act as a key support level for the index. This was followed by the 51,500 strike (17.44 lakh contracts) and the 50,500 strike (11.24 lakh contracts).
The maximum Put writing was observed at the 51,000 strikes (which added 7.34 lakh contracts), followed by the 51,500 strikes (5.83 lakh contracts) and the 50,500 strike (4.76 lakh contracts), while the maximum Put unwinding was seen at the 52,300 strike, which shed 21,255 contracts, followed by the 53,000 strike, which shed 4,800 contracts.
8) Put-Call Ratio
The Nifty Put-Call ratio (PCR), which indicates the mood of the market, jumped to 1.00 on October 24 (the highest level since September 27), from 0.79 levels in the previous session.
The increasing PCR, or being higher than 0.7 or surpassing 1, means traders are selling more Put options than Call options, which generally indicates the firming up of a bullish sentiment in the market. If the ratio falls below 0.7 or moves towards 0.5, then it indicates selling in Calls is higher than selling in Puts, reflecting a bearish mood in the market.
9) India VIX
Volatility snapped a three-day upward move and closed just below the 14 mark. Bulls may not be in a comfortable zone until volatility remains below this level. The India VIX, the fear indicator, fell by 4.46 percent to 13.97, down from the 14.62 level.
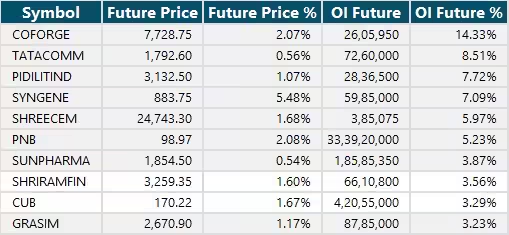
10) Long Build-up (44 Stocks)
A long build-up was seen in 44 stocks. An increase in open interest (OI) and price indicates a build-up of long positions.
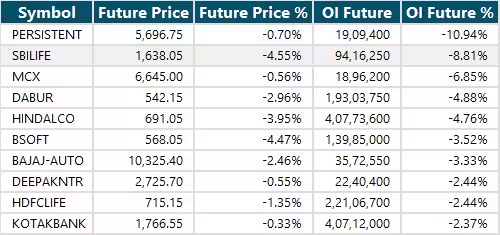
11) Long Unwinding (33 Stocks)
33 stocks saw a decline in open interest (OI) along with a fall in price, indicating long unwinding.
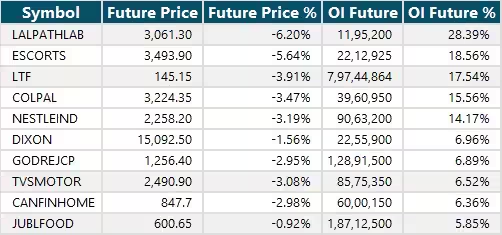
12) Short Build-up (58 Stocks)
58 stocks saw an increase in OI along with a fall in price, indicating a build-up of short positions.
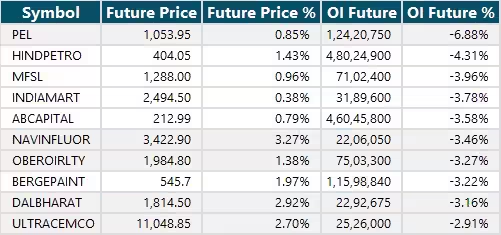
13) Short-Covering (47 Stocks)
47 stocks saw short-covering, meaning a decrease in OI, along with a price increase.
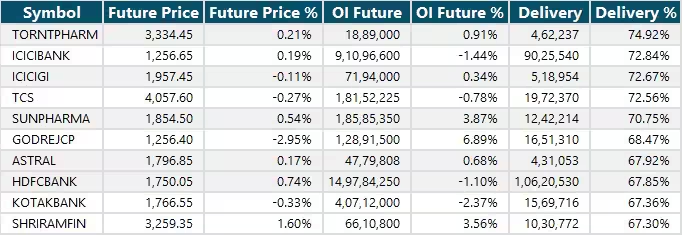
14) High Delivery Trades
Here are the stocks that saw a high share of delivery trades. A high share of delivery reflects investing (as opposed to trading) interest in a stock.
15) Stocks Under F&O Ban
Securities banned under the F&O segment include companies where derivative contracts cross 95 percent of the market-wide position limit.
Stocks added to F&O ban: Escorts Kubota
Stocks retained in F&O ban: Aarti Industries, Bandhan Bank, Indian Energy Exchange, IndiaMART InterMESH, Manappuram Finance, NMDC, Piramal Enterprises, RBL Bank
Stocks removed from F&O ban: Birlasoft, GNFC


0 Comment