12 Jun , 2025 By : Debdeep Gupta

The Nifty 50 faced a hurdle at 25,200 for another session but could not sustain above the same, finishing 37 points higher amid choppy trade on June 11. Further expansion in the upper Bollinger Bands, along with healthy momentum indicators and the VIX hitting a fresh 10-week low, supported the bulls. Hence, if the index decisively closes and sustains above the 25,200 zone, a rally toward 25,300–25,500 could be possible. However, 25,000 is expected to be the immediate key support zone, according to experts.
Here are 15 data points we have collated to help you spot profitable trades:
1) Key Levels For The Nifty 50 (25,141)
Resistance based on pivot points: 25,202, 25,236, and 25,289
Support based on pivot points: 25,094, 25,061, and 25,007
Special Formation: The Nifty 50 formed a Doji-like candlestick pattern on the daily charts, indicating indecision among bulls and bears, while continuing a higher highs formation for the fifth consecutive session. The upper Bollinger Bands expanded further, while the RSI at 62.54 maintained an upward bias. The MACD is on the verge of a positive crossover, with a further improving histogram, which is considered positive.
2) Key Levels For The Bank Nifty (56,460)
Resistance based on pivot points: 56,694, 56,784, and 56,930
Support based on pivot points: 56,401, 56,310, and 56,164
Resistance based on Fibonacci retracement: 57,715, 60,331
Support based on Fibonacci retracement: 56,208, 55,687
Special Formation: The Bank Nifty formed a bearish candle on the daily timeframe, extending the downtrend and maintaining a lower highs–lower lows formation for another session. The index still traded near the upper Bollinger Bands, which remained in expansion mode. The MACD sustained a positive crossover, though it inclined downward slightly. The RSI held near the 60 mark at 63.43, though it showed a slight downward tilt, while the Stochastic RSI displayed a negative crossover.
3) Nifty Call Options Data
According to the weekly options data, the 26,000 strike holds the maximum Call open interest (with 1.43 crore contracts). This level can act as a key resistance for the Nifty in the short term. It was followed by the 25,500 strike (1.22 crore contracts), and the 25,200 strike (1.06 crore contracts).
Maximum Call writing was observed at the 25,250 strike, which saw an addition of 19.81 lakh contracts, followed by the 25,700 and 25,400 strikes, which added 17.16 lakh and 15.84 lakh contracts, respectively. The maximum Call unwinding was seen at the 25,100 strike, which shed 23.62 lakh contracts, followed by the 25,000 and 26,000 strikes which shed 18.02 lakh and 15.65 lakh contracts, respectively.
4) Nifty Put Options Data
On the Put side, the maximum Put open interest was seen at the 24,500 strike (with 98.23 lakh contracts), which can act as a key support level for the Nifty. It was followed by the 25,000 strike (91.68 lakh contracts) and the 25,100 strike (88.05 lakh contracts).
The maximum Put writing was placed at the 25,200 strike, which saw an addition of 32.01 lakh contracts, followed by the 25,100 and 25,150 strikes, which added 25.5 lakh and 23.72 lakh contracts, respectively. The maximum Put unwinding was seen at the 24,400 strike, which shed 11.57 lakh contracts, followed by the 24,250 and 24,300 strikes which shed 3.57 lakh and 3.39 lakh contracts, respectively.
5) Bank Nifty Call Options Data
According to the monthly options data, the 56,000 strike holds the maximum Call open interest, with 19.03 lakh contracts. This can act as a key level for the index in the short term. It was followed by the 57,000 strike (14.52 lakh contracts) and the 58,000 strike (9.79 lakh contracts).
Maximum Call writing was visible at the 58,000 strike (with the addition of 90,210 contracts), followed by the 57,000 strike (86,235 contracts), and the 56,600 strike (81,030 contracts). The maximum Call unwinding was seen at the 55,000 strike, which shed 12,720 contracts, followed by the 55,700 and 56,200 strikes, which shed 11,970 and 8,310 contracts, respectively.
6) Bank Nifty Put Options Data
On the Put side, the maximum Put open interest was seen at the 56,000 strike (with 20.9 lakh contracts), which can act as a key support level for the index. This was followed by the 55,000 strike (13.74 lakh contracts) and the 55,500 strike (7.58 lakh contracts).
The maximum Put writing was observed at the 56,000 strike (which added 68,610 contracts), followed by the 56,400 strike (36,570 contracts) and the 55,000 strike (26,520 contracts). The maximum Put unwinding was seen at the 55,500 strike, which shed 47,010 contracts, followed by the 57,000 and 56,800 strikes, which shed 26,580 and 12,690 contracts, respectively.
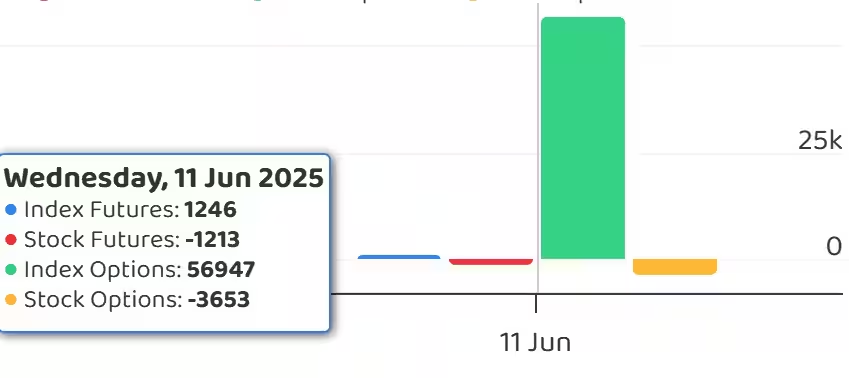
7) Funds Flow (Rs crore)
8) Put-Call Ratio
The Nifty Put-Call ratio (PCR), which indicates the mood of the market, was unchanged at 0.97 on June 11, compared to previous session.
The increasing PCR, or being higher than 0.7 or surpassing 1, means traders are selling more Put options than Call options, which generally indicates the firming up of a bullish sentiment in the market. If the ratio falls below 0.7 or moves towards 0.5, then it indicates selling in Calls is higher than selling in Puts, reflecting a bearish mood in the market.
9) India VIX
The India VIX, which measures expected market volatility, continued its downward journey, falling 2.48 percent to 13.67 — the lowest level since April 3 — offering further comfort to the bulls.
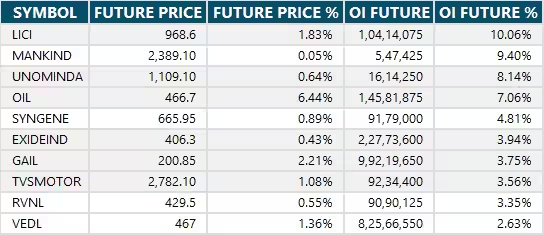
10) Long Build-up (44 Stocks)
A long build-up was seen in 44 stocks. An increase in open interest (OI) and price indicates a build-up of long positions.
11) Long Unwinding (53 Stocks)
53 stocks saw a decline in open interest (OI) along with a fall in price, indicating long unwinding.
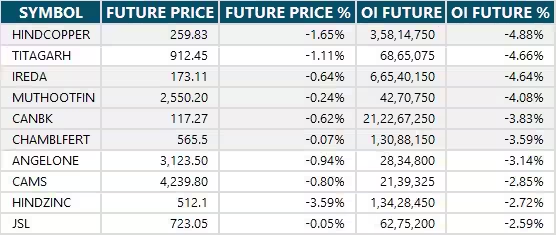
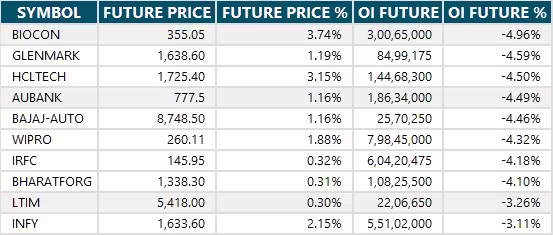
12) Short Build-up (80 Stocks)
80 stocks saw an increase in OI along with a fall in price, indicating a build-up of short positions.
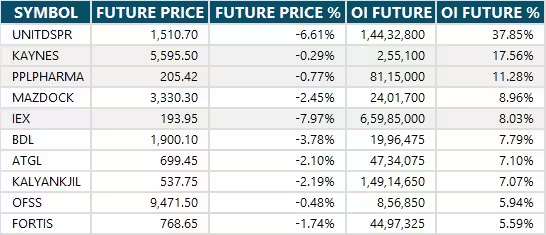
13) Short-Covering (48 Stocks)
48 stocks saw short-covering, meaning a decrease in OI, along with a price increase.
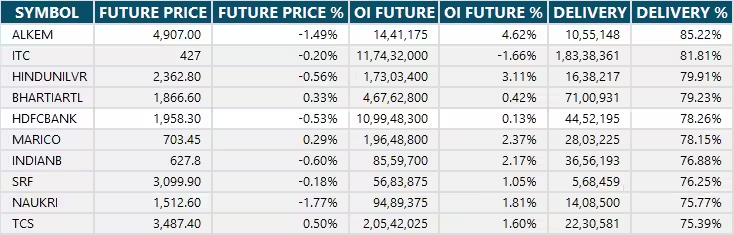
14) High Delivery Trades
Here are the stocks that saw a high share of delivery trades. A high share of delivery reflects investing (as opposed to trading) interest in a stock.
15) Stocks Under F&O Ban
Securities banned under the F&O segment include companies where derivative contracts cross 95 percent of the market-wide position limit.
Stocks added to F&O ban: Central Depository Services, Indian Energy Exchange
Stocks retained in F&O ban: Aditya Birla Fashion and Retail, Chambal Fertilisers and Chemicals, Hindustan Copper, Indian Renewable Energy Development Agency (IREDA), RBL Bank, Titagarh Rail Systems
Stocks removed from F&O ban: Nil


0 Comment