13 Jun , 2025 By : Debdeep Gupta

The market fell 1 percent on June 12 due to profit booking after three days of consolidation, snapping a six-day winning streak. Despite the sharp fall, the index still holds above the 20-day EMA, which remains crucial for the next move. However, momentum indicators have shown a negative crossover. The index decisively broke below the psychological 25,000 mark but found support at 24,800. If the index breaks below this support, a decline toward 24,670—the low of June 6—cannot be ruled out in the upcoming sessions. On the upside, 25,000 is expected to act as an immediate hurdle, according to experts.
Here are 15 data points we have collated to help you spot profitable trades:
1) Key Levels For The Nifty 50 (24,888)
Resistance based on pivot points: 25,112, 25,199, and 25,340
Support based on pivot points: 24,829, 24,741, and 24,600
Special Formation: The Nifty 50 formed a long bearish candle on the daily charts, negating the higher highs formation of the last five sessions, which is a negative signal. Furthermore, the index has broken below the 10-day EMA but is still holding above the 20-day EMA (24,800) as well as the midline of Bollinger bands (24,850), which are crucial for determining the next direction. The RSI at 54.97 showed a negative crossover, while the MACD also remained in a negative crossover with a weakening histogram, although it is still well above the zero line.
2) Key Levels For The Bank Nifty (56,083)
Resistance based on pivot points: 56,466, 56,618, and 56,863
Support based on pivot points: 55,975, 55,824, and 55,578
Resistance based on Fibonacci retracement: 57,743, 60,375
Support based on Fibonacci retracement: 55,679, 55,250
Special Formation: The Bank Nifty also formed a bearish candle on the daily timeframe and maintained a lower highs–lower lows formation for the third consecutive session, falling below the 10-day EMA, which supports the bears. The index declined 0.67% but continues to hold the 20-day EMA as well as the midline of Bollinger bands (55,700), which remains crucial for the next move. The RSI at 57.95 showed a negative crossover. Similarly, the MACD reported a negative crossover with a weakening histogram, though it remains well above the zero line.
3) Nifty Call Options Data
According to the weekly options data, the maximum Call open interest was seen at the 25,200 strike (with 53.19 lakh contracts). This level can act as a key resistance for the Nifty in the short term. It was followed by the 25,500 strike (49.93 lakh contracts), and the 25,100 strike (48.52 lakh contracts).
Maximum Call writing was observed at the 25,000 strike, which saw an addition of 34.4 lakh contracts, followed by the 25,100 and 25,200 strikes, which added 34.03 lakh and 27.58 lakh contracts, respectively. There was hardly any Call unwinding seen in the 23,900-25,900 strike band.
4) Nifty Put Options Data
On the Put side, the 24,000 strike holds the maximum Put open interest (with 52.25 lakh contracts), which can act as a key support level for the Nifty. It was followed by the 24,200 strike (28.14 lakh contracts) and the 24,500 strike (26.37 lakh contracts).
The maximum Put writing was placed at the 24,000 strike, which saw an addition of 24.25 lakh contracts, followed by the 24,900 and 24,200 strikes, which added 16.6 lakh and 13.9 lakh contracts, respectively. The maximum Put unwinding was seen at the 25,200 strike, which shed 2.42 lakh contracts, followed by the 25,150 and 25,300 strikes which shed 1.36 lakh and 1.13 lakh contracts, respectively.
5) Bank Nifty Call Options Data
According to the monthly options data, the maximum Call open interest was seen at the 56,000 strike, with 21.15 lakh contracts. This can act as a key level for the index in the short term. It was followed by the 57,000 strike (16.12 lakh contracts) and the 58,000 strike (10.51 lakh contracts).
Maximum Call writing was visible at the 56,500 strike (with the addition of 2.93 lakh contracts), followed by the 56,000 strike (2.12 lakh contracts), and the 57,000 strike (1.59 lakh contracts). The maximum Call unwinding was seen at the 55,500 strike, which shed 22,260 contracts, followed by the 55,600 and 55,000 strikes, which shed 20,130 and 11,160 contracts, respectively.
6) Bank Nifty Put Options Data
On the Put side, the 56,000 strike holds the maximum Put open interest (with 20.15 lakh contracts), which can act as a key support level for the index. This was followed by the 55,000 strike (12.51 lakh contracts) and the 55,500 strike (7.38 lakh contracts).
The maximum Put writing was observed at the 54,900 strike (which added 28,980 contracts), followed by the 54,800 strike (27,360 contracts) and the 56,300 strike (14,070 contracts). The maximum Put unwinding was seen at the 57,000 strike, which shed 2.08 lakh contracts, followed by the 55,000 and 56,600 strikes, which shed 1.23 lakh and 84,810 contracts, respectively.
7) Funds Flow (Rs crore)

8) Put-Call Ratio
The Nifty Put-Call ratio (PCR), which indicates the mood of the market, dropped to 0.92 on June 12, compared to 0.97 in the previous session.
The increasing PCR, or being higher than 0.7 or surpassing 1, means traders are selling more Put options than Call options, which generally indicates the firming up of a bullish sentiment in the market. If the ratio falls below 0.7 or moves towards 0.5, then it indicates selling in Calls is higher than selling in Puts, reflecting a bearish mood in the market.
9) India VIX
The India VIX, the fear index that measures expected market volatility, rebounded but stayed below the 15 mark, closing at 14.02, up 2.54%. This remains favourable for the bulls.
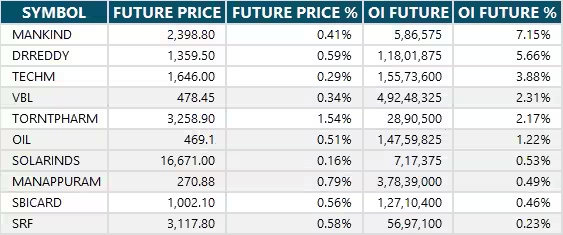
10) Long Build-up (11 Stocks)
A long build-up was seen in 11 stocks. An increase in open interest (OI) and price indicates a build-up of long positions.
11) Long Unwinding (93 Stocks)
93 stocks saw a decline in open interest (OI) along with a fall in price, indicating long unwinding.
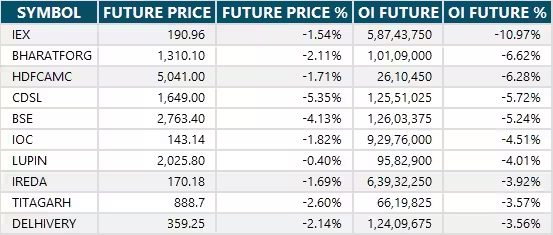
12) Short Build-up (111 Stocks)
111 stocks saw an increase in OI along with a fall in price, indicating a build-up of short positions.
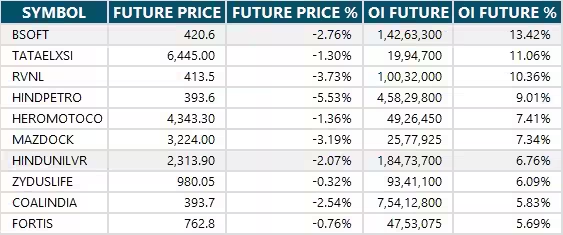
13) Short-Covering (10 Stocks)
10 stocks saw short-covering, meaning a decrease in OI, along with a price increase.

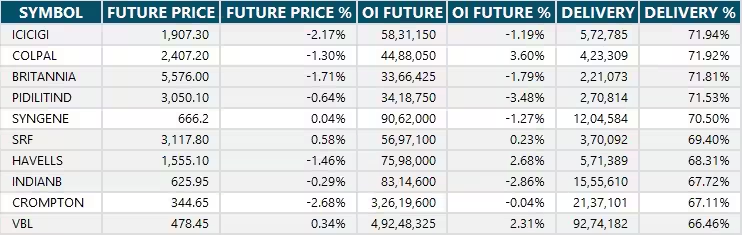
14) High Delivery Trades
Here are the stocks that saw a high share of delivery trades. A high share of delivery reflects investing (as opposed to trading) interest in a stock.
15) Stocks Under F&O Ban
Securities banned under the F&O segment include companies where derivative contracts cross 95 percent of the market-wide position limit.
Stocks added to F&O ban: Birlasoft
Stocks retained in F&O ban: Aditya Birla Fashion and Retail, Central Depository Services, Chambal Fertilisers and Chemicals, Hindustan Copper, Indian Energy Exchange, Indian Renewable Energy Development Agency (IREDA), RBL Bank, Titagarh Rail Systems
Stocks removed from F&O ban: Nil


0 Comment