26 Nov , 2025 By : Debdeep Gupta

The benchmark Nifty 50 extended its downward journey and maintained a lower-high, lower-low structure for the third straight session on November 25, closing the F&O expiry day down by a third of a percent. The momentum indicators signalled caution, but the VIX dropped sharply, and the index still held above 25,850—the immediate support converging with the 20 DEMA, 20 DSMA, and last week’s low. Hence, if the index decisively breaks below this level, a move toward 25,700 and 25,500 cannot be ruled out amid consolidation; however, sustaining above it could bring resistance at 26,000–26,100, experts said.
Here are 15 data points we have collated to help you spot profitable trades:
1) Key Levels For The Nifty 50 (25,885)
Resistance based on pivot points: 25,992, 26,033, and 26,100
Support based on pivot points: 25,858, 25,817, and 25,750
Special Formation: The Nifty 50 formed a bearish candle on the daily timeframe, indicating selling pressure but with lower-than-previous-day and below-average volume. The index fell below the 10-day EMA but continued to sustain above the 20-day and 50-day EMAs and the midline of the Bollinger Bands (20 DSMA). The RSI declined to 54.4, the Stochastic RSI maintained a bearish crossover, and the MACD dropped below its reference line with weakness in the histogram. All of this indicates caution and the possibility of consolidation unless the index holds key support levels.
2) Key Levels For The Bank Nifty (58,820)
Resistance based on pivot points: 59,071, 59,170, and 59,331
Support based on pivot points: 58,750, 58,651, and 58,491
Resistance based on Fibonacci retracement: 59,455, 60,875
Support based on Fibonacci retracement: 58,568, 58,300
Special Formation: The Bank Nifty formed a bearish candle with an upper shadow on the daily charts, signalling pressure at higher levels, but traded within the previous day's range. The index closed flat with a negative bias and continued to trade well above all key moving averages. The RSI at 62.73 remained below the reference line, the Stochastic RSI sustained its bearish crossover, and the MACD maintained a negative crossover with the histogram falling slightly below the zero line. All of this indicates a short-term consolidation or mild corrective phase, while the broader trend remains intact above key supports.
3) Nifty Call Options Data
According to the weekly options data, the 26,000 strike holds the maximum Call open interest (with 71.3 lakh contracts). This level can act as a key resistance level for the Nifty in the short term. It was followed by the 26,500 strike (60.66 lakh contracts) and 26,200 strike (58.58 lakh contracts).
Maximum Call writing was observed at the 26,000 strike, which saw an addition of 41.13 lakh contracts, followed by the 26,500 and 26,200 strikes, which added 33.59 lakh and 25.54 lakh contracts, respectively. There was hardly any Call unwinding seen in the 25,100-26,600 strike band.
4) Nifty Put Options Data
On the Put side, the maximum Put open interest was seen at the 26,000 strike (with 49.69 lakh contracts), which can act as a key level for the Nifty in the short term. It was followed by the 25,500 strike (46.08 lakh contracts) and the 25,400 strike (39.81 lakh contracts).
The maximum Put writing was placed at the 25,400 strike, which saw an addition of 28.1 lakh contracts, followed by the 25,500 and 26,000 strikes, which added 23.33 lakh and 18.69 lakh contracts, respectively. The maximum Put unwinding was seen at the 26,200 strike which shed 1.38 lakh contracts, followed by the 26,400 and 26,600 strikes, which shed 30,900 and 14,775 contracts, respectively.
5) Bank Nifty Call Options Data
According to the monthly options data, the maximum Call open interest was seen at the 58,500 strike, with 12.88 lakh contracts. This can act as a key level for the index in the short term. It was followed by the 59,000 strike (8.25 lakh contracts) and the 60,000 strike (6.38 lakh contracts).
Maximum Call writing was observed at the 59,000 strike (with the addition of 3.67 lakh contracts), followed by the 60,000 strike (1.7 lakh contracts) and 59,200 strike (91,315 contracts). There was hardly any Call unwinding seen in the 57,000-60,750 strike band.
6) Bank Nifty Put Options Data
On the Put side, the 58,500 strike holds the maximum Put open interest (with 19.1 lakh contracts), which can act as a key support level for the index. This was followed by the 59,000 strike (7.89 lakh contracts) and the 58,000 strike (6.06 lakh contracts).
The maximum Put writing was placed at the 59,000 strike (which added 2.07 lakh contracts), followed by the 58,000 strike (1.12 lakh contracts) and the 58,500 strike (87,710 contracts). There was hardly any Put unwinding seen in the 57,000-60,750 strike band.
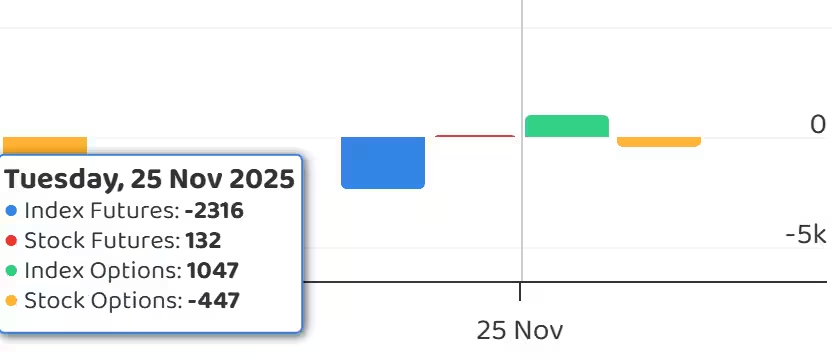
7) Funds Flow (Rs crore)
8) Put-Call Ratio
The Nifty Put-Call ratio (PCR), which indicates the mood of the market, jumped to 0.95 on November 25, compared to 0.77 in the previous session.
The increasing PCR, or being higher than 0.7 or surpassing 1, means traders are selling more Put options than Call options, which generally indicates the firming up of a bullish sentiment in the market. If the ratio falls below 0.7 or moves towards 0.5, then it indicates selling in Calls is higher than selling in Puts, reflecting a bearish mood in the market.
9) India VIX
The India VIX, which measures expected market volatility, declined below the 13 zone, closing 7.5 percent lower at 12.24 and extending its downtrend for the second consecutive session, giving some comfort to the bulls. If the VIX falls and sustains below 12, bulls may find themselves in an even more comfortable zone.
10) Long Build-up (2 Stocks)
A long build-up was seen in 2 stocks. An increase in open interest (OI) and price indicates a build-up of long positions.
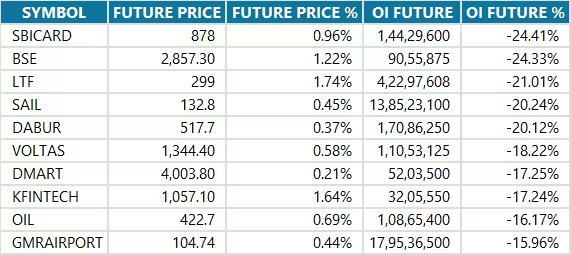
11) Long Unwinding (109 Stocks)
109 stocks saw a decline in open interest (OI) along with a fall in price, indicating long unwinding.
12) Short Build-up (2 Stocks)
2 stocks saw an increase in OI along with a fall in price, indicating a build-up of short positions.
13) Short-Covering (100 Stocks)
100 stocks saw short-covering, meaning a decrease in OI, along with a price increase.
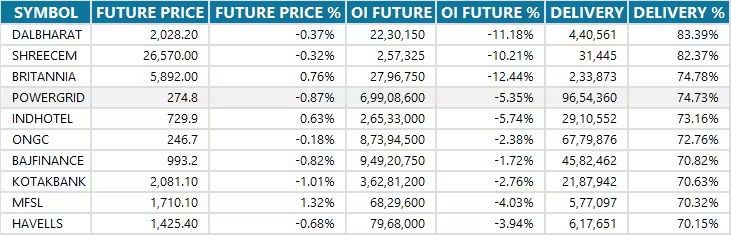
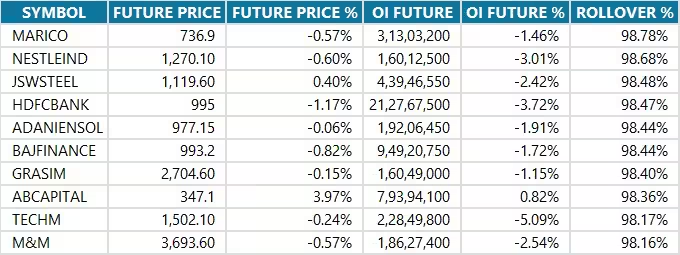
14) High Delivery Trades, and High Rollovers
Here are the stocks that saw a high share of delivery trades. A high share of delivery reflects investing (as opposed to trading) interest in a stock.
Here are the stocks which saw the highest rollovers on expiry day.
15) Stocks Under F&O Ban
Securities banned under the F&O segment include companies where derivative contracts cross 95 percent of the market-wide position limit.
Stocks added to F&O ban: Nil
Stocks retained in F&O ban: Nil
Stocks removed from F&O ban: SAIL, Sammaan Capital


0 Comment