08 Apr , 2025 By : Debdeep Gupta

The market saw a severe gap-down opening on April 7, tracking the crash in global peers, and closed 3 percent lower, though there was a 2 percent recovery from the day's low. The nervousness is unlikely to dissipate easily, considering the weakening technical structure and the global environment post-tariffs. However, there was healthy buying interest from the swing low (21,743). According to experts, 22,000 is likely to be immediate support, followed by 21,700 as crucial support (which can be considered a new lower bottom for the time being). In the event of a bounce back, 22,350-22,400 is likely to act as a hurdle.
Here are 15 data points we have collated to help you spot profitable trades:
1) Key Levels For The Nifty 50 (22,162)
Resistance based on pivot points: 22,248, 22,368, and 22,563
Support based on pivot points: 21,858, 21,738, and 21,543
Special Formation: The Nifty 50 formed a long bullish candlestick pattern on the daily charts, indicating strong buying interest from its swing low, though the closing was disappointing. With Monday's fall, the index traded at the lower end of the Bollinger Bands with above-average volumes, while the momentum indicators RSI (Relative Strength Index) and MACD (Moving Average Convergence Divergence) showed negative crossovers.
2) Key Levels For The Bank Nifty (49,860)
Resistance based on pivot points: 50,299, 50,599, and 51,084
Support based on pivot points: 49,330, 49,030, and 48,545
Resistance based on Fibonacci retracement: 50,267, 50,610
Support based on Fibonacci retracement: 49,368, 48,636
Special Formation: The Bank Nifty also saw a similar trend, witnessing a gap-down opening and closing 3.2 percent down, though it showed a 1.4 percent recovery from the day's low, which resulted in the formation of a bullish candlestick pattern with a long upper shadow on the daily charts. This chart pattern indicated buying interest at lower levels. The banking index dropped below all key moving averages (10, 20, 50, 100, and 200-day EMAs), as well as the midline of the Bollinger Bands, while the RSI gave a negative crossover and the MACD is on the verge of a negative crossover.
3) Nifty Call Options Data
According to the weekly options data, the maximum Call open interest was seen at the 23,000 strike (with 1.04 crore contracts). This level can act as a key resistance for the Nifty in the short term. It was followed by the 23,200 strike (64.53 lakh contracts), and the 22,700 strike (57.17 lakh contracts).
Maximum Call writing was observed at the 22,700 strike, which saw an addition of 53.57 lakh contracts, followed by the 22,000 and 22,500 strikes, which added 49.44 lakh and 40.05 lakh contracts, respectively. The maximum Call unwinding was seen at the 23,200 strike, which shed 40.77 lakh contracts, followed by 23,100 and 23,250 strikes, which shed 24.49 lakh and 14.05 lakh contracts, respectively.
4) Nifty Put Options Data
On the Put side, the 22,000 strike holds the maximum Put open interest (with 77.22 lakh contracts), which can act as a key support level for the Nifty. It was followed by the 21,500 strike (55.07 lakh contracts) and the 22,800 strike (40.22 lakh contracts).
The maximum Put writing was placed at the 22,100 strike, which saw an addition of 7.21 lakh contracts, followed by the 21,500 and 21,400 strikes, which added 6.24 lakh and 6 lakh contracts, respectively. The maximum Put unwinding was seen at the 22,500 strike, which shed 55.19 lakh contracts, followed by the 22,700 and 22,300 strikes, which shed 26.01 lakh and 18.47 lakh contracts, respectively.
5) Bank Nifty Call Options Data
According to the monthly options data, the 52,000 strike holds the maximum Call open interest, with 13.02 lakh contracts. This can act as a key resistance level for the index in the short term. It was followed by the 51,000 strike (9.12 lakh contracts) and the 51,500 strike (8.24 lakh contracts).
Maximum Call writing was visible at the 50,000 strike (with the addition of 3.47 lakh contracts), followed by the 51,000 strike (1.86 lakh contracts) and the 50,500 strike (1.75 lakh contracts). The maximum Call unwinding was seen at the 51,500 strike, which shed 1.27 lakh contracts, followed by the 51,600 and 51,700 strikes, which shed 98,100 and 71,970 contracts, respectively.
6) Bank Nifty Put Options Data
On the Put side, the maximum Put open interest was seen at the 50,000 strike (with 10.84 lakh contracts), which can act as a key level for the index. This was followed by the 48,000 strike (8.95 lakh contracts) and the 49,000 strike (8.36 lakh contracts).
The maximum Put writing was observed at the 49,600 strike (which added 74,370 contracts), followed by the 49,900 strike (47,580 contracts) and the 49,300 strike (44,370 contracts). The maximum Put unwinding was seen at the 51,000 strike, which shed 4.68 lakh contracts, followed by the 50,000 and 51,500 strikes, which shed 4.41 lakh and 3.94 lakh contracts, respectively.
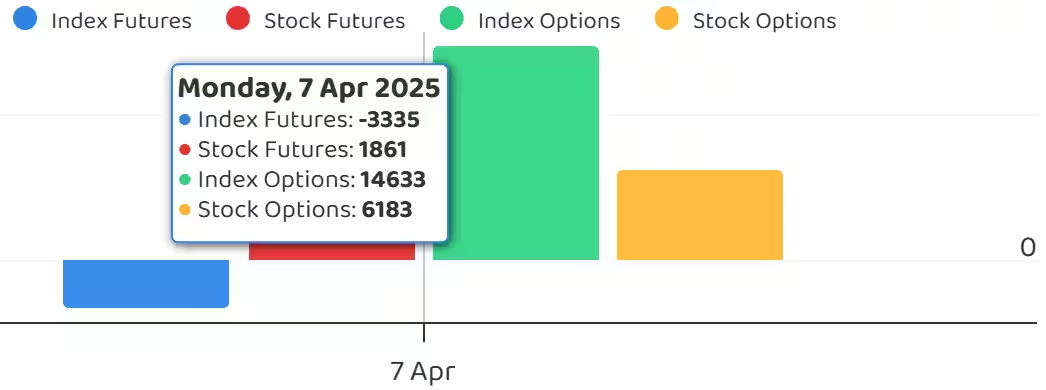
7) Funds Flow (Rs crore)
8) Put-Call Ratio
The Nifty Put-Call ratio (PCR), which indicates the mood of the market, fell to 0.72 on April 7, against 0.74 in the previous session.
The increasing PCR, or being higher than 0.7 or surpassing 1, means traders are selling more Put options than Call options, which generally indicates the firming up of a bullish sentiment in the market. If the ratio falls below 0.7 or moves towards 0.5, then it indicates selling in Calls is higher than selling in Puts, reflecting a bearish mood in the market.
9) India VIX
The India VIX, the fear gauge, surged significantly to the 22.79 zone, the highest closing level since June 4, 2024, up 65.70 percent in a single session, which made the bulls more uncomfortable. Hence, the bulls need to be cautious going forward.
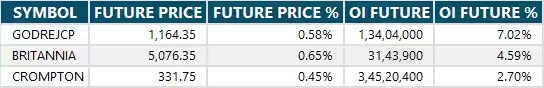
10) Long Build-up (3 Stocks)
A long build-up was seen in 3 stocks. An increase in open interest (OI) and price indicates a build-up of long positions.
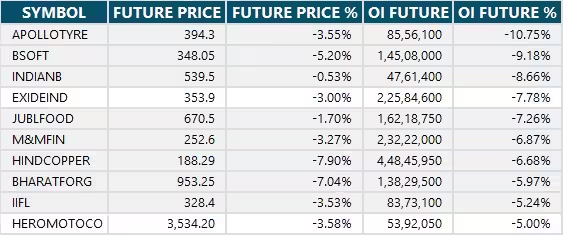
11) Long Unwinding (113 Stocks)
113 stocks saw a decline in open interest (OI) along with a fall in price, indicating long unwinding.
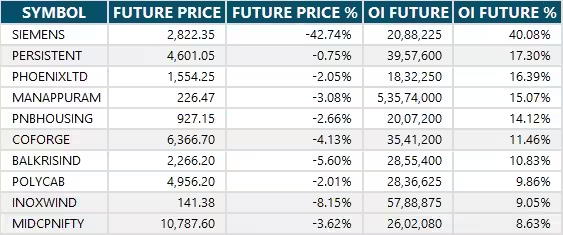
12) Short Build-up (99 Stocks)
99 stocks saw an increase in OI along with a fall in price, indicating a build-up of short positions.
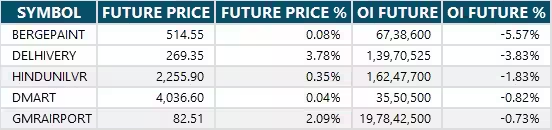
13) Short-Covering (5 Stocks)
5 stocks saw short-covering, meaning a decrease in OI, along with a price increase.
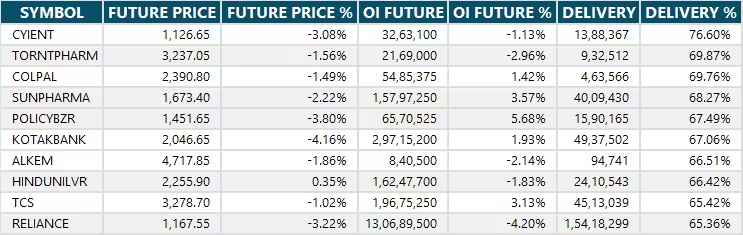
14) High Delivery Trades
Here are the stocks that saw a high share of delivery trades. A high share of delivery reflects investing (as opposed to trading) interest in a stock.
15) Stocks Under F&O Ban
Securities banned under the F&O segment include companies where derivative contracts cross 95 percent of the market-wide position limit.
Stocks added to F&O ban: Manappuram Finance
Stocks retained in F&O ban: Birlasoft, Hindustan Copper
Stocks removed from F&O ban: Nil


0 Comment