07 Apr , 2025 By : Debdeep Gupta

The Nifty 50 nosedived sharply by 1.5 percent on April 4, as bears dominated Dalal Street, driving the index down by 1,000 points since the recent swing high of March 25. This was in line with weakness in global counterparts, with the Nasdaq entering bear territory. China's retaliation, by imposing 34 percent tariffs on all US products a day after Trump's tariffs, raised fears of a US recession. The index entered the lower band of the Bollinger Bands, signaling further weakness. The next crucial support is placed at 22,500, which experts feel, if broken, could see a move towards the 22,300-22,000 zone. However, in the case of a bounce back, 23,000 is likely to be an immediate hurdle.
Here are 15 data points we have collated to help you spot profitable trades:
1) Key Levels For The Nifty 50 (22,904)
Resistance based on pivot points: 23,129, 23,213, and 23,349
Support based on pivot points: 22,856, 22,771, and 22,635
Special Formation: The Nifty 50 formed a long bearish candlestick pattern with above-average volumes, indicating that bears are in a strong position. The formation of lower highs for the fourth consecutive session, along with the index falling below the midline of the Bollinger Bands and below the 50 percent Fibonacci retracement (from March low to high), is negative. The momentum indicators also signal a weak trend, as the RSI (Relative Strength Index) dropped below the 50 mark to 45.93, and the MACD (Moving Average Convergence Divergence) is on the verge of a negative crossover.
2) Key Levels For The Bank Nifty (51,503)
Resistance based on pivot points: 51,789, 51,915, and 52,119
Support based on pivot points: 51,382, 51,256, and 51,052
Resistance based on Fibonacci retracement: 51,883, 53,020
Support based on Fibonacci retracement: 51,263, 50,273
Special Formation: The Bank Nifty could not sustain the trendline breakout and closed 95 points down, forming a bearish candle with both upper and lower shadows on the daily timeframe. However, it still traded well above all key moving averages (10, 20, 50, 100, and 200-day EMAs), with all short-to-medium EMAs trending upward, which is positive. The RSI tilted downward but still held above the 60 mark (64.31), and the MACD remained well above the zero line.
3) Nifty Call Options Data
According to the weekly options data, the 23,200 strike holds the maximum Call open interest (with 1.05 crore contracts). This level can act as a key resistance for the Nifty in the short term. It was followed by the 23,000 strike (98.48 lakh contracts), and the 23,500 strike (90.84 lakh contracts).
Maximum Call writing was observed at the 23,000 strike, which saw an addition of 84.65 lakh contracts, followed by the 23,200 and 23,100 strikes, which added 83.29 lakh and 63.8 lakh contracts, respectively. There was hardly any maximum Call unwinding seen in the 22,050-23,900 strike band.
4) Nifty Put Options Data
On the Put side, the maximum Put open interest was seen at the 22,000 strike (with 83.22 lakh contracts), which can act as a key support level for the Nifty. It was followed by the 22,500 strike (77.07 lakh contracts) and the 22,800 strike (57.4 lakh contracts).
The maximum Put writing was placed at the 22,500 strike, which saw an addition of 29.97 lakh contracts, followed by the 22,000 and 22,900 strikes, which added 24.57 lakh and 19.73 lakh contracts, respectively. The maximum Put unwinding was seen at the 23,200 strike, which shed 22.16 lakh contracts, followed by the 23,000 and 23,300 strikes, which shed 19.77 lakh and 17.75 lakh contracts, respectively.
5) Bank Nifty Call Options Data
According to the monthly options data, the maximum Call open interest was seen at the 53,000 strike, with 14.78 lakh contracts. This can act as a key resistance level for the index in the short term. It was followed by the 52,000 strike (12.02 lakh contracts) and the 51,500 strike (9.52 lakh contracts).
Maximum Call writing was visible at the 53,500 strike (with the addition of 1.79 lakh contracts), followed by the 52,500 strike (1.09 lakh contracts) and the 51,500 strike (1 lakh contracts). The maximum Call unwinding was seen at the 51,000 strike, which shed 40,740 contracts, followed by the 51,300 and 51,200 strikes, which shed 33,570 and 25,290 contracts, respectively.
6) Bank Nifty Put Options Data
On the Put side, the 50,000 strike holds the maximum Put open interest (with 15.26 lakh contracts), which can act as a key support level for the index. This was followed by the 51,000 strike (11.19 lakh contracts) and the 51,500 strike (8.6 lakh contracts).
The maximum Put writing was observed at the 50,000 strike (which added 1.74 lakh contracts), followed by the 50,400 strike (28,920 contracts) and the 52,200 strike (28,350 contracts). The maximum Put unwinding was seen at the 53,000 strike, which shed 2.76 lakh contracts, followed by the 51,300 and 51,500 strikes, which shed 1.34 lakh and 53,280 contracts, respectively.
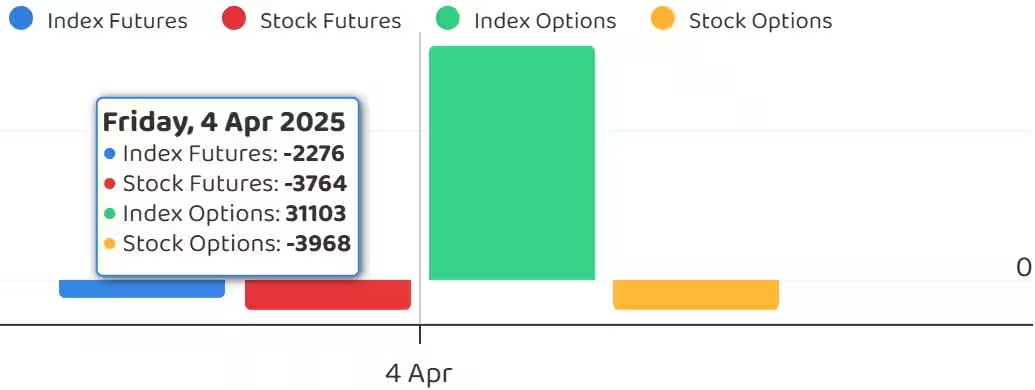
7) Funds Flow (Rs crore)
8) Put-Call Ratio
The Nifty Put-Call ratio (PCR), which indicates the mood of the market, dropped sharply to 0.74 on April 4, against 1.12 in the previous session.
The increasing PCR, or being higher than 0.7 or surpassing 1, means traders are selling more Put options than Call options, which generally indicates the firming up of a bullish sentiment in the market. If the ratio falls below 0.7 or moves towards 0.5, then it indicates selling in Calls is higher than selling in Puts, reflecting a bearish mood in the market.
9) India VIX
The India VIX, which measures expected market volatility, increased by 1.14 percent to 13.76 after a couple of days of downtrend. The VIX sustained above short-term moving averages, creating discomfort for bulls.
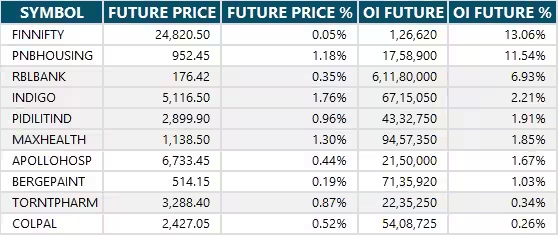
10) Long Build-up (10 Stocks)
A long build-up was seen in 10 stocks. An increase in open interest (OI) and price indicates a build-up of long positions.
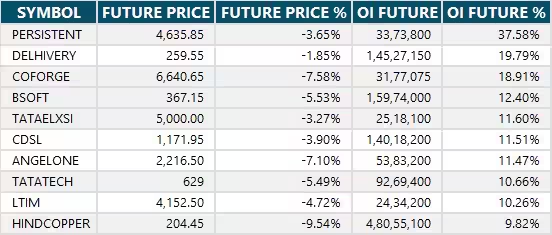
11) Long Unwinding (84 Stocks)
84 stocks saw a decline in open interest (OI) along with a fall in price, indicating long unwinding.
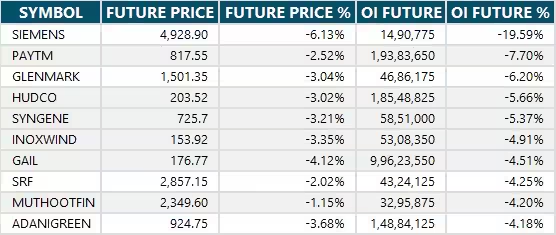
12) Short Build-up (117 Stocks)
117 stocks saw an increase in OI along with a fall in price, indicating a build-up of short positions.
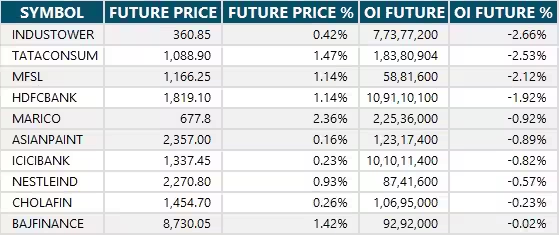
13) Short-Covering (10 Stocks)
10 stocks saw short-covering, meaning a decrease in OI, along with a price increase.
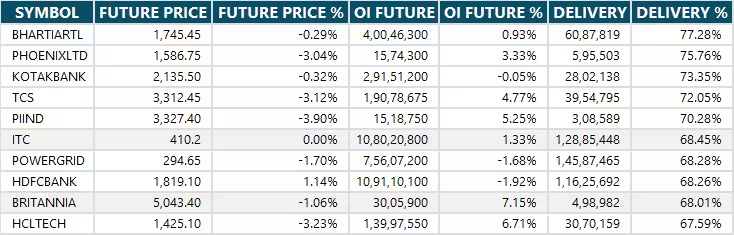
14) High Delivery Trades
Here are the stocks that saw a high share of delivery trades. A high share of delivery reflects investing (as opposed to trading) interest in a stock.
15) Stocks Under F&O Ban
Securities banned under the F&O segment include companies where derivative contracts cross 95 percent of the market-wide position limit.
Stocks added to F&O ban: Birlasoft, Hindustan Copper
Stocks retained in F&O ban: Nil
Stocks removed from F&O ban: Nil


0 Comment