19 Mar , 2026 By : Debdeep Gupta

The Nifty 50 remained in positive territory for the third straight day, rising 0.83 percent on March 18 and gaining 3.5 percent from its recent low. The recovery has been supported by improving momentum after the index hit oversold territory, along with a falling VIX. However, the broader trend still reflects a pattern of lower tops and lower bottoms, with momentum indicators signalling caution. Oil prices spiked after consolidating over the past couple of sessions amid the West Asia conflict, while higher-than-expected inflation data reduced the likelihood of further Fed rate cuts in 2026. Hence, if the index breaks 23,600 (Wednesday's low), a decline toward the 23,500–23,350 zone is possible in the coming sessions. However, a further rally toward 24,000 is likely only if the index closes above and sustains the 23,800 resistance level, according to experts.
Here are 15 data points we have collated to help you spot profitable trades:
1) Key Levels For The Nifty 50 (23,778)
Resistance based on pivot points: 23,846, 23,903, and 23,997
Support based on pivot points: 23,660, 23,602, and 23,509
Special Formation: The Nifty 50 formed a bullish candle with a minor upper shadow on the daily charts, signalling a positive bias despite some pressure at higher levels. The index closed above the previous high and held above the golden ratio (61.8 percent Fibonacci retracement level—just above 23,500) for the second straight session, which is a positive sign. There has been some improvement in momentum indicators, but they still signal caution. The RSI climbed to 37.04 from the recent low of 24.15 but remains below the 40 mark, while the MACD continues to stay below both the reference and zero lines. The index is still trading below all key moving averages, which continue to slope downward. All these factors indicate that, despite the ongoing pullback, the broader trend remains weak and requires further confirmation of strength.
2) Key Levels For The Bank Nifty (55,326)
Resistance based on pivot points: 55,520, 55,724, and 56,055
Support based on pivot points: 54,859, 54,655, and 54,325
Resistance based on Fibonacci retracement: 56,473, 57,484
Support based on Fibonacci retracement: 54,727, 53,067
Special Formation: The Bank Nifty rose 0.82 percent and formed a bullish candle with minor upper and lower shadows on the daily charts, indicating a continuation of the pullback despite some volatility for the third straight session. The index remained above the 50 percent Fibonacci retracement level for another session; however, trading volumes have been declining. Additionally, key moving averages continue to slope downward, with the 20-day EMA on the verge of falling below the 200-day EMA, and the 50-day EMA also close to slipping below the 100-day EMA. The RSI inched up to 35.11 from around 23 but remains below the 40 level, while the MACD is still well below both the signal and zero lines, although histogram weakness has eased further. All these factors indicate that, while the pullback is intact, the broader trend still lacks strong bullish confirmation.
3) Nifty Call Options Data
According to the weekly options data, the 24,500 strike holds the maximum Call open interest (with 43.88 lakh contracts). This level can act as a key resistance level for the Nifty in the short term. It was followed by the 24,000 strike (43.45 lakh contracts) and 23,800 strike (33.98 lakh contracts).
Maximum Call writing was observed at the 23,800 strike, which saw an addition of 17.69 lakh contracts, followed by the 23,700 and 24,500 strikes, which added 16.39 lakh and 14.82 lakh contracts, respectively. The maximum Call unwinding was seen at the 23,500 strike, which shed 8.13 lakh contracts, followed by the 23,400 and 23,550 strikes, which shed 3.23 lakh and 2.75 lakh contracts, respectively.
4) Nifty Put Options Data
On the Put side, the maximum Put open interest was seen at the 23,000 strike (with 54.98 lakh contracts), which can act as a key support level for the Nifty in the short term. It was followed by the 23,500 strike (47.87 lakh contracts) and the 23,700 strike (36.26 lakh contracts).
The maximum Put writing was placed at the 23,700 strike, which saw an addition of 30.45 lakh contracts, followed by the 23,800 and 23,500 strikes, which added 25.75 lakh and 20.9 lakh contracts, respectively. There was hardly any Put unwinding seen in the 23,000-24,500 strike band.
5) Bank Nifty Call Options Data
According to the monthly options data, the 56,000 strike holds the maximum Call open interest, with 7.7 lakh contracts. This can act as a key resistance level for the index in the short term. It was followed by the 57,000 strike (6.78 lakh contracts) and the 55,000 strike (6.21 lakh contracts).
Maximum Call writing was observed at the 55,500 strike (with the addition of 75,960 contracts), followed by the 55,400 strike (33,630 contracts) and 56,800 strike (30,150 contracts). The maximum Call unwinding was seen at the 54,500 strike, which shed 51,300 contracts, followed by the 54,000 and 54,900 strikes, which shed 35,220 and 26,850 contracts, respectively.
6) Bank Nifty Put Options Data
On the Put side, the maximum Put open interest was seen at the 54,000 strike (with 8.2 lakh contracts), which can act as a key support level for the index. This was followed by the 55,000 strike (7.3 lakh contracts) and the 56,000 strike (4.71 lakh contracts).
The maximum Put writing was placed at the 55,000 strike (which added 1.84 lakh contracts), followed by the 54,000 (1.61 lakh contracts) and 55,100 (89,280 contracts). The maximum Put unwinding was seen at the 57,000 strike, which shed 19,905 contracts, followed by the 54,700 and 54,300 strikes, which shed 13,530 and 12,690 contracts, respectively.
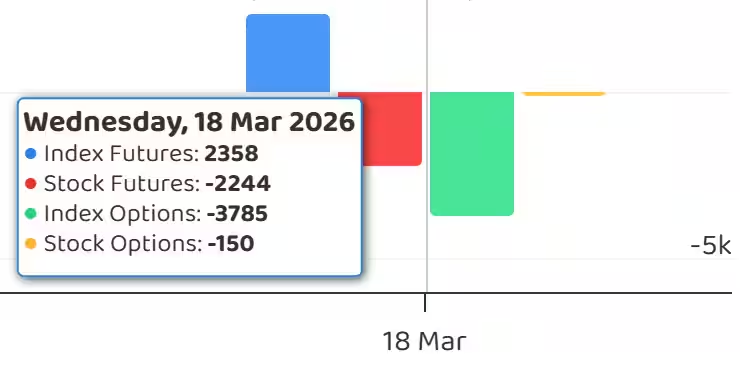
7) Funds Flow (Rs crore)
8) Put-Call Ratio
The Nifty Put-Call ratio (PCR), which indicates the mood of the market, jumped to 1.14 on March 18, compared to a 1.09 in previous session.
The increasing PCR, or being higher than 0.7 or surpassing 1, means traders are selling more Put options than Call options, which generally indicates the firming up of a bullish sentiment in the market. If the ratio falls below 0.7 or moves towards 0.5, then it indicates selling in Calls is higher than selling in Puts, reflecting a bearish mood in the market.
9) India VIX
The India VIX, which measures expected market volatility, slipped 5.39 percent to 18.72, extending its downward trend for the third straight session and signalling increasing comfort for bulls. However, it remains in an elevated zone. Stronger comfort for bulls is likely only if it falls and sustains decisively below the 15–13 levels.
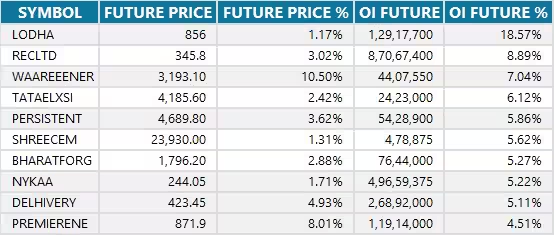
10) Long Build-up (113 Stocks)
A long build-up was seen in 113 stocks. An increase in open interest (OI) and price indicates a build-up of long positions.
11) Long Unwinding (12 Stocks)
12 stocks saw a decline in open interest (OI) along with a fall in price, indicating long unwinding.
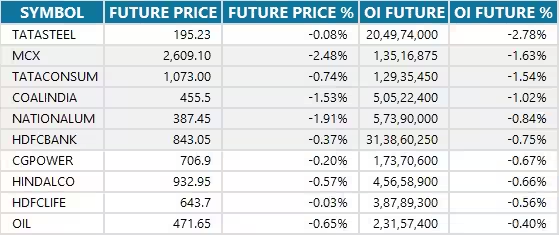
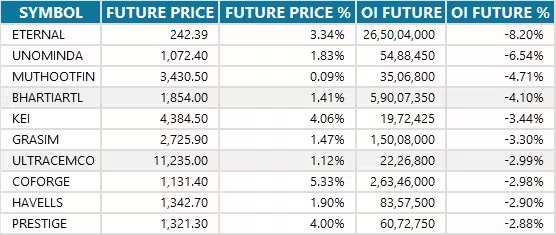
12) Short Build-up (15 Stocks)
15 stocks saw an increase in OI along with a fall in price, indicating a build-up of short positions.
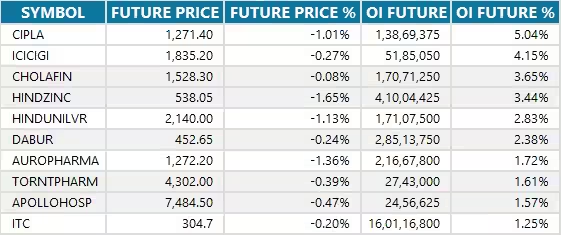
13) Short-Covering (70 Stocks)
70 stocks saw short-covering, meaning a decrease in OI, along with a price increase.
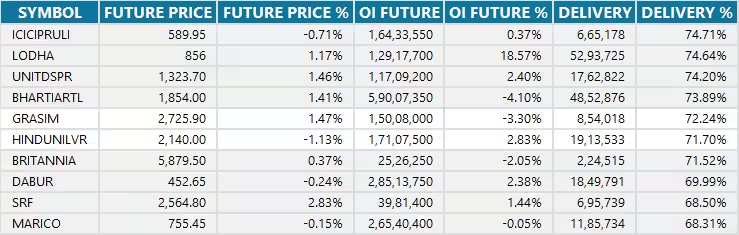
14) High Delivery Trades
Here are the stocks that saw a high share of delivery trades. A high share of delivery reflects investing (as opposed to trading) interest in a stock.
15) Stocks Under F&O Ban
Securities banned under the F&O segment include companies where derivative contracts cross 95 percent of the market-wide position limit.
Stocks added to F&O ban: Nil
Stocks retained in F&O ban: SAIL, Sammaan Capital
Stocks removed from F&O ban: Nil


0 Comment