29 Jul , 2025 By : Debdeep Gupta

The Nifty 50 corrected 0.6 percent on July 28, extending its downtrend for the third consecutive session and sustaining below the lower line of the Bollinger Bands, as well as below short- and medium-term moving averages. Considering the bearish momentum indicators, the index is likely to consolidate further with a negative bias. According to experts, the 24,600–24,550 zone (which includes the 100-day EMA) and 24,470 (the June low) are the key downside levels to watch. A breach below these could trigger a major sell-off. On the upside, in case of a rebound, the 24,800–24,900 range could act as a resistance zone.
Here are 15 data points we have collated to help you spot profitable trades:
1) Key Levels For The Nifty 50 (24,681)
Resistance based on pivot points: 24,832, 24,889, and 24,982
Support based on pivot points: 24,646, 24,589, and 24,496
Special Formation: The Nifty 50 formed a bearish candle with an upper shadow on the daily charts, indicating weakness and selling pressure at higher levels. The index continued its lower highs–lower lows formation for yet another session and traded below both short- and medium-term moving averages. It is now approaching the 100-day EMA. The Relative Strength Index (RSI) dropped below 40 and stood at 36.92, while the MACD histogram weakened further. This indicates increasing bearish momentum.
2) Key Levels For The Bank Nifty (56,085)
Resistance based on pivot points: 56,442, 56,579, and 56,801
Support based on pivot points: 55,998, 55,861, and 55,639
Resistance based on Fibonacci retracement: 56,646, 57,057
Support based on Fibonacci retracement: 55,666, 55,124
Special Formation: The Bank Nifty declined 0.8 percent and also formed a bearish candle with a long upper shadow on the daily charts, signaling selling pressure at higher levels. The index fell below the recent swing low with above-average volumes. It traded below the 50-day EMA, with a bearish crossover in both the RSI and the Stochastic RSI. The MACD histogram also showed further weakness with a bearish crossover. This reinforces the negative trend in the banking space.
3) Nifty Call Options Data
According to the monthly options data, the maximum Call open interest was seen at the 25,000 strike (with 1.58 crore contracts). This level can act as a key resistance for the Nifty in the short term. It was followed by the 25,200 strike (1.29 crore contracts), and the 25,500 strike (1.2 crore contracts).
Maximum Call writing was observed at the 24,800 strike, which saw an addition of 79.25 lakh contracts, followed by the 24,700 and 24,900 strikes, which added 39.3 lakh and 32.3 lakh contracts, respectively. The maximum Call unwinding was seen at the 24,000 strike, which shed 62,250 contracts, followed by the 24,100 and 23,950 strikes, which shed 2,175 and 1,500 contracts, respectively.
4) Nifty Put Options Data
On the Put side, the 24,000 strike holds the maximum Put open interest (with 83.9 lakh contracts), which can act as a key support level for the Nifty. It was followed by the 24,500 strike (74.11 lakh contracts) and the 24,600 strike (59.8 lakh contracts).
The maximum Put writing was placed at the 24,600 strike, which saw an addition of 17.08 lakh contracts, followed by the 24,200 and 24,500 strikes, which added 13.06 lakh and 10.72 lakh contracts, respectively. The maximum Put unwinding was seen at the 25,000 strike, which shed 14.6 lakh contracts, followed by the 24,850 and 24,900 strikes, which shed 11.11 lakh and 9.97 lakh contracts, respectively.
5) Bank Nifty Call Options Data
According to the monthly options data, the 57,000 strike hold the maximum Call open interest, with 24.03 lakh contracts. This can act as a key resistance level for the index in the short term. It was followed by the 58,000 strike (15.81 lakh contracts) and the 57,500 strike (15.22 lakh contracts).
Maximum Call writing was visible at the 56,500 strike (with the addition of 4.23 lakh contracts), followed by the 57,000 strike (3.56 lakh contracts), and the 56,400 strike (2.85 lakh contracts). The maximum Call unwinding was seen at the 57,700 strike, which shed 59,465 contracts, followed by the 57,600 and 58,100 strikes, which shed 54,565 and 36,365 contracts, respectively.
6) Bank Nifty Put Options Data
On the Put side, the maximum Put open interest was seen at the 56,000 strike (with 12.01 lakh contracts), which can act as a key support level for the index. This was followed by the 55,000 strike (10.19 lakh contracts) and the 57,000 strike (8.37 lakh contracts).
The maximum Put writing was observed at the 54,500 strike (which added 1.59 lakh contracts), followed by the 56,100 strike (1.17 lakh contracts) and the 55,400 strike (85,750 contracts). The maximum Put unwinding was seen at the 57,000 strike, which shed 1.79 lakh contracts, followed by the 56,500 and 56,800 strikes, which shed 1.54 lakh and 1.47 lakh contracts, respectively.
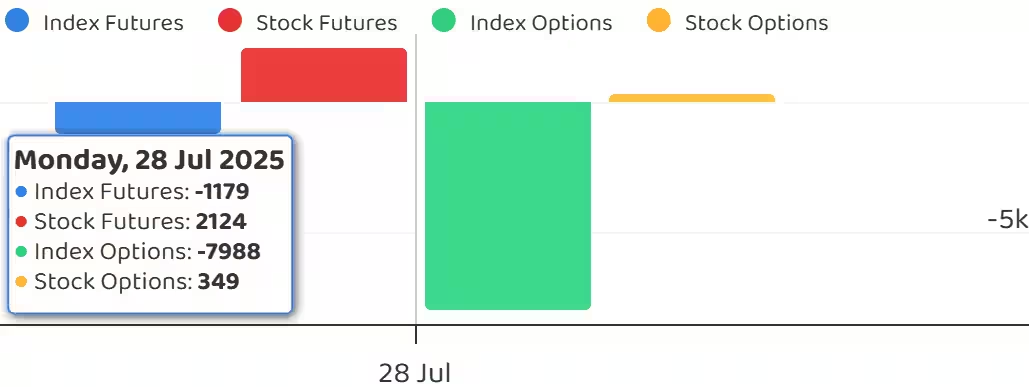
7) Funds Flow (Rs crore)
8) Put-Call Ratio
The Nifty Put-Call ratio (PCR), which indicates the mood of the market, fell further to 0.64 on July 28 (the lowest level since December 18, 2024), compared to 0.7 in the previous session.
The increasing PCR, or being higher than 0.7 or surpassing 1, means traders are selling more Put options than Call options, which generally indicates the firming up of a bullish sentiment in the market. If the ratio falls below 0.7 or moves towards 0.5, then it indicates selling in Calls is higher than selling in Puts, reflecting a bearish mood in the market.
9) India VIX
The India VIX, also known as the fear index, jumped further to 12.06, its highest closing level since July 8, rising 6.98 percent and extending its uptrend for the third straight session. This signals growing caution among bulls.
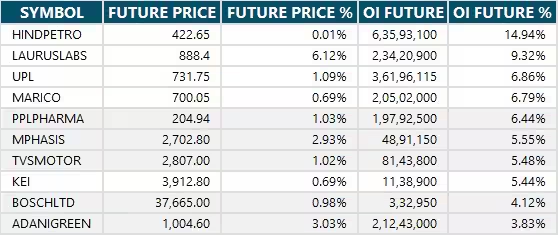
10) Long Build-up (40 Stocks)
A long build-up was seen in 40 stocks. An increase in open interest (OI) and price indicates a build-up of long positions.
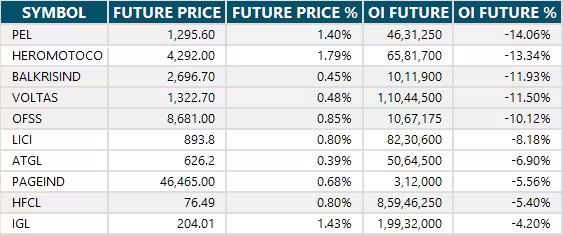
11) Long Unwinding (91 Stocks)
91 stocks saw a decline in open interest (OI) along with a fall in price, indicating long unwinding.
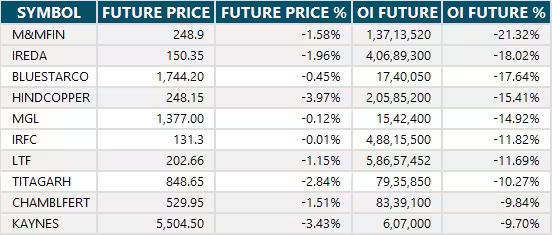
12) Short Build-up (62 Stocks)
62 stocks saw an increase in OI along with a fall in price, indicating a build-up of short positions.
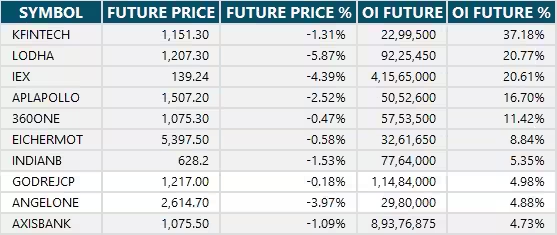
13) Short-Covering (35 Stocks)
35 stocks saw short-covering, meaning a decrease in OI, along with a price increase.
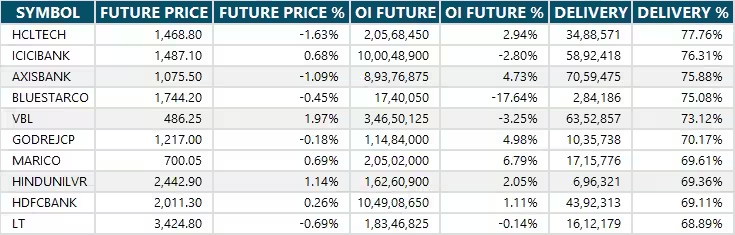
14) High Delivery Trades
Here are the stocks that saw a high share of delivery trades. A high share of delivery reflects investing (as opposed to trading) interest in a stock.
15) Stocks Under F&O Ban
Securities banned under the F&O segment include companies where derivative contracts cross 95 percent of the market-wide position limit.
Stocks added to F&O ban: Nil
Stocks retained in F&O ban: RBL Bank
Stocks removed from F&O ban: Nil


0 Comment