18 Mar , 2025 By : Debdeep Gupta

Bulls seem to have returned to Dalal Street after a week of consolidation, driving the Nifty 50 beyond 22,500 with a half-percent gain on March 17, tracking positive global cues. The index has approached not only the midline of the Bollinger Bands (22,560) but also the 20-day EMA (22,600), along with a favourable VIX for bulls. If the index extends its rally in the upcoming sessions, it may face resistance at 22,600-22,700. Sustaining above this zone could open doors for a strong uptrend toward 23,000. However, until the index trades below this zone, the consolidation may continue, with 22,300 acting as support, according to experts.
Here are 15 data points we have collated to help you spot profitable trades:
1) Key Levels For The Nifty 50 (22,509)
Resistance based on pivot points: 22,565, 22,618, and 22,703
Support based on pivot points: 22,394, 22,341, and 22,256
Special Formation: The Nifty 50 formed a bullish candlestick pattern with a minor upper shadow on the daily charts, closing above the 5- and 10-day EMAs, which is positive. The index tested the midline of the Bollinger Bands but needs to cross and sustain above it for a further upward journey. Additionally, if there is a decisive trendline breakout in the upcoming sessions (adjoining highs of March 10 and 17), the index may make an attempt to close the bearish gap zone from February 24.
2) Key Levels For The Bank Nifty (48,354)
Resistance based on pivot points: 48,453, 48,520, and 48,629
Support based on pivot points: 48,235, 48,168, and 48,059
Resistance based on Fibonacci retracement: 49,308, 50,289
Support based on Fibonacci retracement: 47,883, 46,078
Special Formation: The Bank Nifty reported a bullish candlestick pattern with an upper shadow on the daily timeframe, indicating some pressure at higher levels. The index closed above the 5- and 10-day EMAs, and there was a breakout of the resistance trendline on Monday (adjoining highs of February 7 and March 6), which is positive. The index extended its gains with higher highs and higher lows formation for the third consecutive session, rising 0.6 percent.
3) Nifty Call Options Data
According to the weekly options data, the maximum Call open interest was seen at the 23,500 strike (with 98.74 lakh contracts). This level can act as a key resistance for the Nifty in the short term. It was followed by the 23,000 strike (88.53 lakh contracts), the 22,800 strike (79.74 lakh contracts), and 22,700 strike (77.46 lakh contracts).
Maximum Call writing was observed at the 22,850 strike, which saw an addition of 45.98 lakh contracts, followed by the 22,800 and 23,000 strikes, which added 43.16 lakh and 36.69 lakh contracts, respectively. The maximum Call unwinding was seen at the 22,400 strike, which shed 14.96 lakh contracts, followed by the 22,200 and 22,150 strikes, which shed 40,875 and 11,550 contracts, respectively.
4) Nifty Put Options Data
On the Put side, the 22,000 strike holds the maximum Put open interest (with 85.57 lakh contracts), which can act as a key support level for the Nifty. It was followed by the 22,500 strike (83.98 lakh contracts) and the 22,300 strike (73.45 lakh contracts).
The maximum Put writing was placed at the 22,500 strike, which saw an addition of 53.21 lakh contracts, followed by the 22,300 and 22,200 strikes, which added 49.25 lakh and 27.91 lakh contracts, respectively. The maximum Put unwinding was seen at the 22,000 strike, which shed 7.42 lakh contracts, followed by the 23,000 and 23,200 strikes, which shed 32,325 and 4,575 contracts, respectively.
5) Bank Nifty Call Options Data
According to the monthly options data, the 49,000 strike holds the maximum Call open interest, with 18.96 lakh contracts. This can act as a key resistance level for the index in the short term. It was followed by the 50,000 strike (15.74 lakh contracts) and the 48,500 strike (13.08 lakh contracts).
Maximum Call writing was visible at the 50,400 strike (with the addition of 1.62 lakh contracts), followed by the 48,500 strike (64,920 contracts) and the 48,400 strike (62,190 contracts). The maximum Call unwinding was seen at the 48,000 strike, which shed 2.27 lakh contracts, followed by the 48,100 and 48,200 strikes, which shed 1.52 lakh and 1.36 lakh contracts, respectively.
6) Bank Nifty Put Options Data
On the Put side, the maximum Put open interest was seen at the 48,000 strike (with 16.03 lakh contracts), which can act as a key support level for the index. This was followed by the 47,000 strike (12.68 lakh contracts) and the 48,500 strike (9.86 lakh contracts).
The maximum Put writing was observed at the 48,500 strike (which added 3.16 lakh contracts), followed by the 48,400 strike (2.03 lakh contracts) and the 48,300 strike (1.47 lakh contracts). The maximum Put unwinding was seen at the 49,500 strike, which shed 8,625 contracts, followed by the 48,900 and 48,700 strikes which shed 5,520 and 5,100 contracts, respectively.
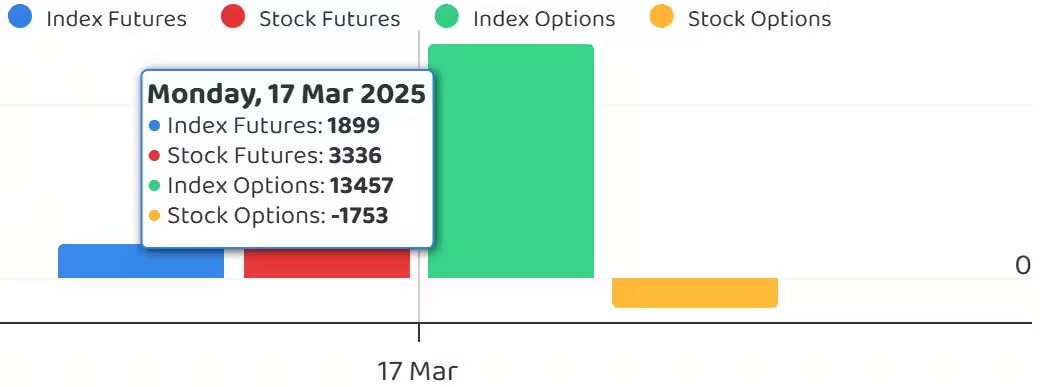
7) Funds Flow (Rs crore)
8) Put-Call Ratio
The Nifty Put-Call ratio (PCR), which indicates the mood of the market, rose to 1.05 on March 17, against 1.02 in the previous session.
The increasing PCR, or being higher than 0.7 or surpassing 1, means traders are selling more Put options than Call options, which generally indicates the firming up of a bullish sentiment in the market. If the ratio falls below 0.7 or moves towards 0.5, then it indicates selling in Calls is higher than selling in Puts, reflecting a bearish mood in the market.
9) India VIX
The India VIX, the fear index, sustained below all key moving averages and remained in the lower zone. Though it gained 1.02 percent to reach 13.42 levels on Monday, it continues to maintain comfort for bulls.
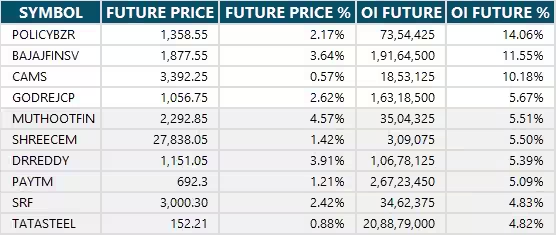
10) Long Build-up (101 Stocks)
A long build-up was seen in 101 stocks. An increase in open interest (OI) and price indicates a build-up of long positions.
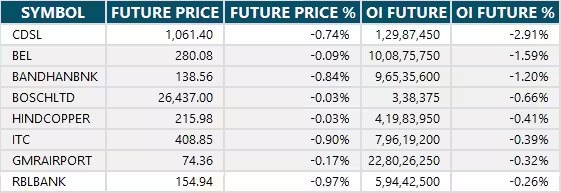
11) Long Unwinding (8 Stocks)
8 stocks saw a decline in open interest (OI) along with a fall in price, indicating long unwinding.
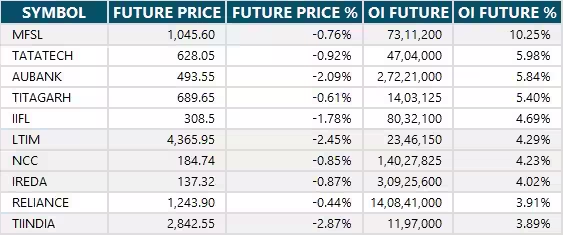
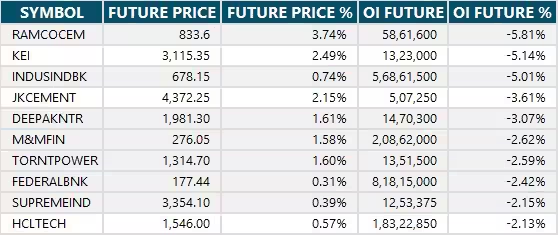
12) Short Build-up (39 Stocks)
39 stocks saw an increase in OI along with a fall in price, indicating a build-up of short positions.
13) Short-Covering (72 Stocks)
72 stocks saw short-covering, meaning a decrease in OI, along with a price increase.
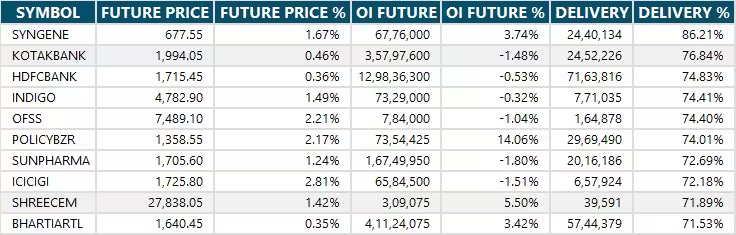
14) High Delivery Trades
Here are the stocks that saw a high share of delivery trades. A high share of delivery reflects investing (as opposed to trading) interest in a stock.
15) Stocks Under F&O Ban
Securities banned under the F&O segment include companies where derivative contracts cross 95 percent of the market-wide position limit.
Stocks added to F&O ban:
Stocks retained in F&O ban: BSE, IndusInd Bank, Hindustan Copper, Manappuram Finance, SAIL
Stocks removed from F&O ban: Nil


0 Comment