30 Jan , 2025 By : Debdeep Gupta

The market gained more strength with the Nifty 50 rising 0.9 percent on January 29, a day before the expiry of January series derivative contracts due on January 30. The index climbed above the crucial 23,000 mark and closed above the 10-day EMA (23,134), but the trend is still in favor of bears due to the continuation of the lower tops-lower bottoms formation. The index needs to surpass and sustain above the 23,350-23,400 range to negate this lower top-lower bottom formation, as above it, 23,600-23,700 is expected to be a key hurdle (200-day and 50-day EMA). However, as long as it stays below 23,400, the consolidation may continue, with support at the 23,000-22,900 zone, according to experts.
Here are 15 data points we have collated to help you spot profitable trades:
1) Key Levels For The Nifty 50 (23,163)
Resistance based on pivot points: 23,187, 23,235, and 23,314
Support based on pivot points: 23,029, 22,980, and 22,901
Special Formation: The Nifty 50 formed a bullish candlestick pattern on the daily charts with the continuation of the higher high-higher low formation for another session. But the trend is still in favor of bears, as the index traded in the lower band of the Bollinger bands and below the 20, 50, 100, and 200-day EMAs. Furthermore, the momentum indicators – the RSI (Relative Strength Index) showed a positive crossover but still in the lower band, and the MACD (Moving Average Convergence Divergence) remains below the zero line.
2) Key Levels For The Bank Nifty (49,166)
Resistance based on pivot points: 49,205, 49,288, and 49,422
Support based on pivot points: 48,938, 48,856, and 48,722
Resistance based on Fibonacci retracement: 49,412, 50,381
Support based on Fibonacci retracement: 47,875, 46,078
Special Formation: Bulls appear supportive of the Bank Nifty, which continued its upward journey for the second consecutive session, forming a bullish candlestick pattern on the daily charts, while there has been above-average volume for the third consecutive session. The index stayed above the 10-day EMA for another session and tested the midline of the Bollinger bands intraday, which is a positive sign. However, the index is still below the 20, 50, 100, and 200-day EMAs and continues to show the lower high-lower low pattern, which can only be negated upon decisively surpassing the 49,650 zone on the higher side.
3) Nifty Call Options Data
According to the monthly options data, the 24,000 strike holds the maximum Call open interest (with 1.26 crore contracts). This level can act as a key resistance for the Nifty in the short term. It was followed by the 23,000 strike (76.52 lakh contracts) and the 23,500 strike (74.4 lakh contracts).
Maximum Call writing was observed at the 23,150 strike, which saw an addition of 12.75 lakh contracts, followed by the 23,600 and 23,900 strikes, which added 8.64 lakh and 8.56 lakh contracts, respectively. The maximum Call unwinding was seen at the 23,000 strike which shed 9.69 lakh contracts, followed by the 23,200 and 23,300 strikes which shed 9.34 lakh and 5.82 lakh contracts, respectively.
4) Nifty Put Options Data
On the Put side, the maximum Put open interest was seen at the 23,000 strike (with 1.19 crore contracts), which can act as a key support level for the Nifty. It was followed by the 22,000 strike (1.15 crore contracts) and the 22,500 strike (1.01 crore contracts).
The maximum Put writing was placed at the 22,500 strike, which saw an addition of 37.44 lakh contracts, followed by the 23,100 and 23,000 strikes, which added 30.23 lakh and 17.23 lakh contracts, respectively. The maximum Put unwinding was seen at the 22,200 strike, which shed 9.35 lakh contracts, followed by the 22,000 and 23,700 strikes, which shed 5.62 lakh and 2.48 lakh contracts, respectively.
5) Bank Nifty Call Options Data
According to the monthly options data, the 51,000 strike holds the maximum Call open interest, with 26.65 lakh contracts. This can act as a key resistance level for the index in the short term. It was followed by the 50,000 strike (24.28 lakh contracts) and the 50,500 strike (18.17 lakh contracts).
Maximum Call writing was visible at the 49,100 strike (with the addition of 3.67 lakh contracts), followed by the 49,200 strike (2.74 lakh contracts) and the 50,200 strike (2.16 lakh contracts). The maximum Call unwinding was seen at the 48,500 strike, which shed 1.23 lakh contracts, followed by the 48,600 and 51,000 strikes, which shed 99,525 and 93,765 contracts, respectively.
6) Bank Nifty Put Options Data
On the Put side, the maximum Put open interest was seen at the 47,000 strike (with 19.71 lakh contracts), which can act as a key support level for the index. This was followed by the 48,000 strike (19.34 lakh contracts) and the 49,000 strike (18.67 lakh contracts).
The maximum Put writing was observed at the 48,200 strike (which added 11.53 lakh contracts), followed by the 49,000 strike (6.82 lakh contracts) and the 49,100 strike (3.48 lakh contracts). The maximum Put unwinding was seen at the 47,800 strike, which shed 8.42 lakh contracts, followed by the 48,800 and 46,900 strikes which shed 1.15 lakh and 75,555 contracts, respectively.
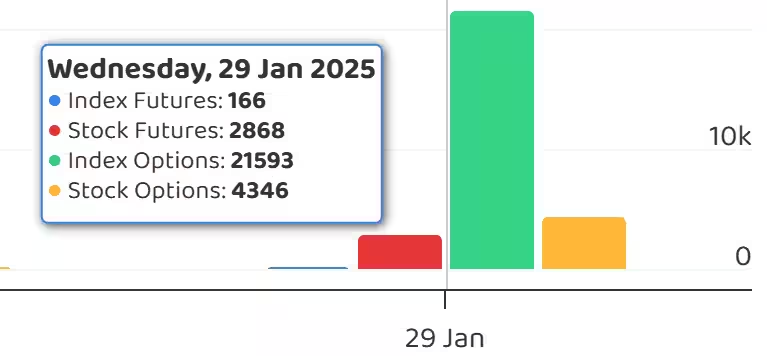
7) Funds Flow (Rs crore)
8) Put-Call Ratio
The Nifty Put-Call ratio (PCR), which indicates the mood of the market, jumped to 1.06 on January 29, from 0.95 level in the previous session.
The increasing PCR, or being higher than 0.7 or surpassing 1, means traders are selling more Put options than Call options, which generally indicates the firming up of a bullish sentiment in the market. If the ratio falls below 0.7 or moves towards 0.5, then it indicates selling in Calls is higher than selling in Puts, reflecting a bearish mood in the market.
9) India VIX
The volatility index, India VIX, which measures expected market volatility, climbed further and hit a nearly six-month high, rising 2.45 percent to 18.64 (the highest closing level since August 6, 2024). The elevated levels indicated caution for bulls ahead of the Budget, which is scheduled to be presented on February 1.
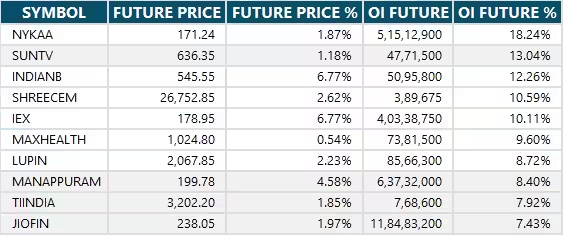
10) Long Build-up (84 Stocks)
A long build-up was seen in 84 stocks. An increase in open interest (OI) and price indicates a build-up of long positions.
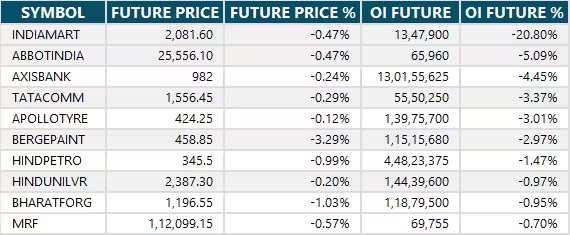
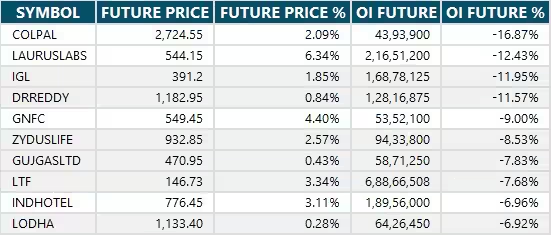
11) Long Unwinding (15 Stocks)
15 stocks saw a decline in open interest (OI) along with a fall in price, indicating long unwinding.
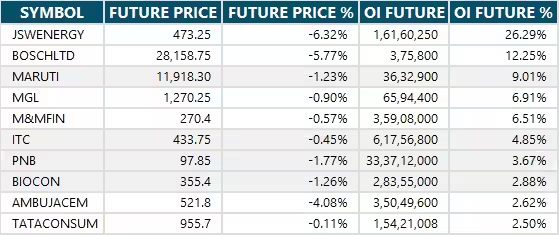
12) Short Build-up (18 Stocks)
18 stocks saw an increase in OI along with a fall in price, indicating a build-up of short positions.
13) Short-Covering (111 Stocks)
111 stocks saw short-covering, meaning a decrease in OI, along with a price increase.
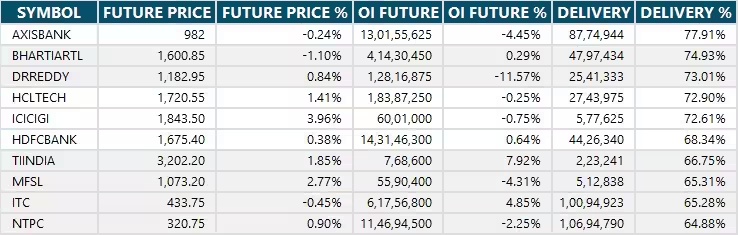
14) High Delivery Trades
Here are the stocks that saw a high share of delivery trades. A high share of delivery reflects investing (as opposed to trading) interest in a stock.
15) Stocks Under F&O Ban
Securities banned under the F&O segment include companies where derivative contracts cross 95 percent of the market-wide position limit.
Stocks added to F&O ban: Nil
Stocks retained in F&O ban: Nil
Stocks removed from F&O ban: Nil


0 Comment