09 Nov , 2025 By : Debdeep Gupta

The Nifty 50 significantly cut down intraday losses and defended the key support zone placed at 25,300–25,350, which converged with the 50-day EMA, the 50 percent Fibonacci retracement of the recent sharp rally, the falling earlier resistance trendline (now acting as a support line), and the 10-week EMA. However, it still ended with moderate losses on November 7. Experts suggest that if the index manages to hold 25,300 in the upcoming sessions, a gradual upmove toward 25,650–25,800 and then 26,000 could be possible amid consolidation. On the other hand, a decisive break below this level could drive the index toward 25,000.
Here are 15 data points we have collated to help you spot profitable trades:
1) Key Levels For The Nifty 50 (25,492)
Resistance based on pivot points: 25,543, 25,598, and 25,687
Support based on pivot points: 25,365, 25,310, and 25,221
Special Formation: The Nifty 50 formed a bullish candle with a minor upper shadow and a long lower shadow on the daily charts, indicating strong buying interest at lower levels and some pressure at higher levels amid volatility. The index remained below short-term moving averages and the midline of the Bollinger Band, but still above medium- and long-term moving averages. The RSI (at 49.16) and MACD remained below their reference lines, while the histogram weakened further, indicating bearish momentum.
2) Key Levels For The Bank Nifty (57,877)
Resistance based on pivot points: 58,001, 58,200, and 58,522
Support based on pivot points: 57,356, 57,157, and 56,835
Resistance based on Fibonacci retracement: 58,735, 60,142
Support based on Fibonacci retracement: 57,394, 56,662
Special Formation: The Bank Nifty outperformed the Nifty 50 on Friday, rising 323 points and forming a bullish candle with both upper and lower shadows on the daily timeframe, signaling a positive trend. The index also climbed back above short-term moving averages and the midline of the Bollinger Band. The RSI moved upward to 60.03, though it still maintained a bearish crossover, while the MACD remained below the reference line with continued weakness in the histogram. All these factors indicate a cautious yet improving momentum.
3) Nifty Call Options Data
According to the weekly options data, the 26,000 strike holds the maximum Call open interest (with 1.5 crore contracts). This level can act as a key resistance for the Nifty in the short term. It was followed by the 25,700 strike (1.05 crore contracts) and 25,600 strike (96.41 lakh contracts).
Maximum Call writing was observed at the 25,500 strike, which saw an addition of 38.3 lakh contracts, followed by the 25,400 and 26,000 strikes, which added 29.93 lakh and 24.34 lakh contracts, respectively. The maximum Call unwinding was seen at the 26,050 strike, which shed 21.44 lakh contracts, followed by the 26,300 and 26,350 strikes, which shed 15.46 lakh and 12.93 lakh contracts, respectively.
4) Nifty Put Options Data
On the Put side, the maximum Put open interest was seen at the 25,300 strike (with 1.19 crore contracts), which can act as a key support level for the Nifty. It was followed by the 25,000 strike (1.13 lakh contracts) and the 25,400 strike (1.06 crore contracts).
The maximum Put writing was placed at the 25,300 strike, which saw an addition of 64.38 lakh contracts, followed by the 25,400 and 25,350 strikes, which added 48.91 lakh and 43.15 lakh contracts, respectively. The maximum Put unwinding was seen at the 25,700 strike, which shed 15.22 lakh contracts, followed by the 25,550 and 25,600 strikes, which shed 12.42 lakh and 10.78 lakh contracts, respectively.
5) Bank Nifty Call Options Data
According to the monthly options data, the maximum Call open interest was seen at the 58,000 strike, with 15.29 lakh contracts. This can act as a key resistance level for the index in the short term. It was followed by the 58,500 strike (13.41 lakh contracts) and the 60,000 strike (10.83 lakh contracts).
Maximum Call writing was observed at the 58,500 strike (with the addition of 2.76 lakh contracts), followed by the 58,800 strike (45,290 contracts) and 56,800 strike (43,645 contracts). The maximum Call unwinding was seen at the 57,000 strike, which shed 2.92 lakh contracts, followed by the 57,700 and 58,000 strikes, which shed 58,905 and 58,590 contracts, respectively.
6) Bank Nifty Put Options Data
On the Put side, the 58000 strike holds the maximum Put open interest (with 15.16 lakh contracts), which can act as a key level for the index. This was followed by the 57,000 strike (12.7 lakh contracts) and the 58,500 strike (9.66 lakh contracts).
The maximum Put writing was placed at the 58,500 strike (which added 5.01 lakh contracts), followed by the 57,500 strike (1.73 lakh contracts) and the 57,000 strike (1.71 lakh contracts). The maximum Put unwinding was seen at the 58,000 strike which shed 2.03 lakh contracts, followed by the 57,600 and 58,900 strikes, which shed 49,560 and 33,320 contracts, respectively.
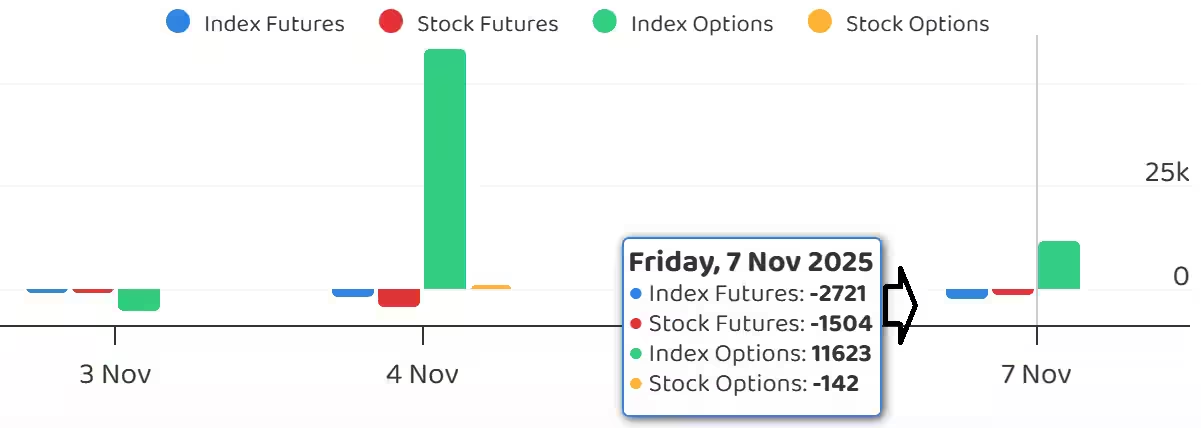
7) Funds Flow (Rs crore)
8) Put-Call Ratio
The Nifty Put-Call ratio (PCR), which indicates the mood of the market, climbed to 0.93 on November 7, compared to 0.77 in the previous session.
The increasing PCR, or being higher than 0.7 or surpassing 1, means traders are selling more Put options than Call options, which generally indicates the firming up of a bullish sentiment in the market. If the ratio falls below 0.7 or moves towards 0.5, then it indicates selling in Calls is higher than selling in Puts, reflecting a bearish mood in the market.
9) India VIX
The India VIX, which measures expected market volatility, still signalled some caution for bulls as it stayed above its short- and medium-term moving averages. The index rose 1.19 percent to 12.56, after a two-day decline. It remained below the 13 zone, above which there would be discomfort for bulls.
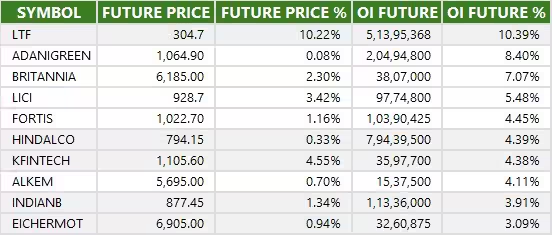
10) Long Build-up (73 Stocks)
A long build-up was seen in 73 stocks. An increase in open interest (OI) and price indicates a build-up of long positions.
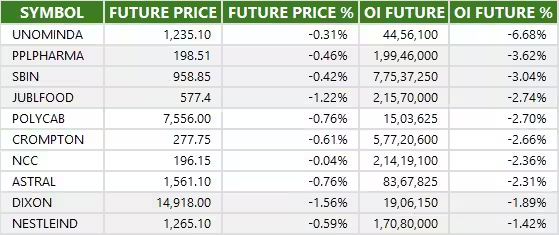
11) Long Unwinding (28 Stocks)
28 stocks saw a decline in open interest (OI) along with a fall in price, indicating long unwinding.
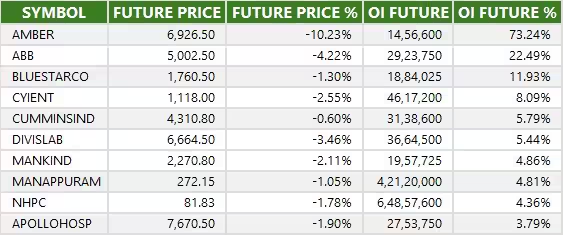
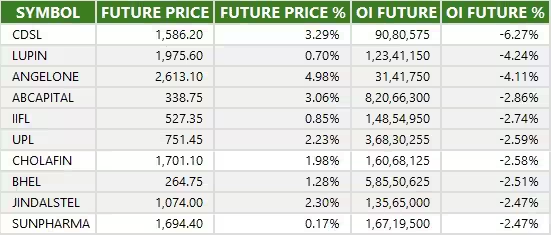
12) Short Build-up (55 Stocks)
55 stocks saw an increase in OI along with a fall in price, indicating a build-up of short positions.
13) Short-Covering (55 Stocks)
55 stocks saw short-covering, meaning a decrease in OI, along with a price increase.
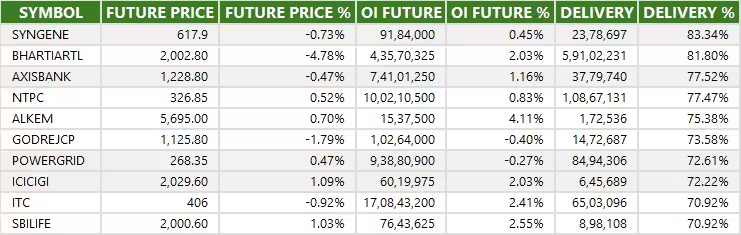
14) High Delivery Trades
Here are the stocks that saw a high share of delivery trades. A high share of delivery reflects investing (as opposed to trading) interest in a stock.
15) Stocks Under F&O Ban
Securities banned under the F&O segment include companies where derivative contracts cross 95 percent of the market-wide position limit.
Stocks added to F&O ban: Nil
Stocks retained in F&O ban: Nil
Stocks removed from F&O ban: Nil


0 Comment