13 Oct , 2025 By : Debdeep Gupta

Bulls maintained their hold over the market, decisively driving the Nifty 50 above the 25,200–25,250 zone with a 0.4 percent gain on October 10.
Going forward, the index is expected to face resistance at the 25,400–25,450 levels, which will be crucial for its continued upward journey. However, the sharp correction in US counterparts on Friday may impact sentiment in Indian equities on Monday.
Still, this is unlikely to alter the broader market trend as long as the Nifty 50 continues to sustain firmly above all key moving averages and the midline of the Bollinger Bands. The 25,000–24,900 range is expected to act as a key support zone in upcoming sessions. A fall below this zone could give the bears an upper hand, according to experts.
Here are 15 data points we have collated to help you spot profitable trades:
1) Key Levels For The Nifty 50 (25,285)
Resistance based on pivot points: 25,324, 25,365, and 25,432
Support based on pivot points: 25,191, 25,150, and 25,084
Special Formation: The Nifty 50 formed a bullish candle with a minor upper shadow on the daily charts, indicating a positive trend despite selling pressure at higher levels. The index remained above all key moving averages and the midline of the Bollinger Bands on both daily and weekly timeframes. The RSI stood at 61, and the MACD maintained a bullish crossover, with further strength seen in the histogram on the daily charts. On the weekly scale, the RSI was at 57.1 with a positive crossover, though the MACD continued to show a negative crossover with the histogram below the zero line. All these indicators suggest underlying strength in the trend, despite mixed signals.
2) Key Levels For The Bank Nifty (56,610)
Resistance based on pivot points: 56,740, 56,883, and 57,115
Support based on pivot points: 56,275, 56,132, and 55,900
Resistance based on Fibonacci retracement: 56,758, 57,628
Support based on Fibonacci retracement: 56,005, 55,538
Special Formation: The Bank Nifty also formed a bullish candle with a minor upper shadow on the daily timeframe, signalling a bullish trend despite some pressure at higher levels. The index rallied 418 points and closed at the upper Bollinger Band, with the RSI at 66.76. The MACD maintained a bullish crossover with consistent strength in the histogram. However, the Stochastic RSI turned sideways for a couple of sessions, showing a slight negative crossover. Notably, the index decisively closed above the falling resistance trendline (near 56,300). All these factors indicate continued strength with a possibility of further upside, albeit with some caution due to short-term momentum indicators.
3) Nifty Call Options Data
According to the weekly options data, the 26,000 strike holds the maximum Call open interest (with 1.25 crore contracts). This level can act as a key resistance for the Nifty in the short term. It was followed by the 25,500 strike (1.11 crore contracts), and the 25,400 strike (1.02 crore contracts).
Maximum Call writing was observed at the 25,450 strike, which saw an addition of 32.41 lakh contracts, followed by the 25,650 and 25,350 strikes, which added 19.74 lakh and 19.28 lakh contracts, respectively. The maximum Call unwinding was seen at the 25,200 strike, which shed 65.78 lakh contracts, followed by the 25,150 and 25,100 strikes, which shed 24.7 lakh and 19.18 lakh contracts, respectively.
4) Nifty Put Options Data
On the Put side, the maximum Put open interest was seen at the 25,200 strike (with 1.37 crore contracts), which can act as a key support level for the Nifty. It was followed by the 25,000 strike (1.32 crore contracts) and the 25,100 strike (1.22 crore contracts).
The maximum Put writing was placed at the 25,300 strike, which saw an addition of 86.14 lakh contracts, followed by the 25,250 and 25,200 strikes, which added 72.64 lakh and 68.95 lakh contracts, respectively. The maximum Put unwinding was seen at the 25,050 strike, which shed 13.17 lakh contracts, followed by the 25,000 and 26,000 strikes, which shed 4.92 lakh and 24,075 contracts, respectively.
5) Bank Nifty Call Options Data
According to the monthly options data, the maximum Call open interest was seen at the 57,000 strike, with 21.74 lakh contracts. This can act as a key resistance level for the index in the short term. It was followed by the 58,000 strike (11.88 lakh contracts) and the 56,000 strike (8.9 lakh contracts).
Maximum Call writing was observed at the 58,500 strike (with the addition of 1.18 lakh contracts), followed by the 56,700 (1.13 lakh contracts) and 58,700 strike (62,020 contracts). The maximum Call unwinding was seen at the 56,000 strike, which shed 1.85 lakh contracts, followed by the 56,200 and 56,300 strikes, which shed 1.64 lakh and 1.01 lakh contracts, respectively.
6) Bank Nifty Put Options Data
On the Put side, the 55,000 strike holds the maximum Put open interest (with 16.26 lakh contracts), which can act as a key support level for the index. This was followed by the 57,000 strike (14.99 lakh contracts) and the 56,000 strike (12.47 lakh contracts).
The maximum Put writing was placed at the 57,000 strike (which added 3.5 lakh contracts), followed by the 56,500 strike (2.31 lakh contracts) and the 56,600 strike (1.57 lakh contracts). The maximum Put winding was seen at the 55,000 strike which shed 1.05 lakh contracts, followed by the 56,100 and 55,900 strikes, which shed 74,970 and 2,520 contracts, respectively.
7) Funds Flow (Rs crore)

8) Put-Call Ratio
The Nifty Put-Call ratio (PCR), which indicates the mood of the market, climbed to 1.32 on October 10, compared to 1.06 in the previous session.
The increasing PCR, or being higher than 0.7 or surpassing 1, means traders are selling more Put options than Call options, which generally indicates the firming up of a bullish sentiment in the market. If the ratio falls below 0.7 or moves towards 0.5, then it indicates selling in Calls is higher than selling in Puts, reflecting a bearish mood in the market.
9) India VIX
The India VIX, which measures expected market volatility, remained consolidative below short-term moving averages and fell 0.17 percent on Friday to 10.10, indicating a continued comfort zone for the market.
10) Long Build-up (66 Stocks)
A long build-up was seen in 66 stocks. An increase in open interest (OI) and price indicates a build-up of long positions.

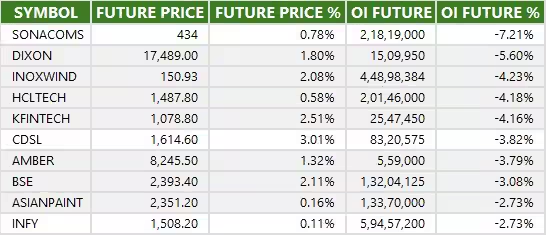
11) Long Unwinding (23 Stocks)
23 stocks saw a decline in open interest (OI) along with a fall in price, indicating long unwinding.

12) Short Build-up (53 Stocks)
53 stocks saw an increase in OI along with a fall in price, indicating a build-up of short positions.

13) Short-Covering (71 Stocks)
71 stocks saw short-covering, meaning a decrease in OI, along with a price increase.
14) High Delivery Trades
Here are the stocks that saw a high share of delivery trades. A high share of delivery reflects investing (as opposed to trading) interest in a stock.

15) Stocks Under F&O Ban
Securities banned under the F&O segment include companies where derivative contracts cross 95 percent of the market-wide position limit.
Stocks added to F&O ban: Sammaan Capital
Stocks retained in F&O ban: RBL Bank
Stocks removed from F&O ban: Nil


0 Comment