07 Nov , 2025 By : Debdeep Gupta

The Nifty 50 extended its southward journey for the second consecutive session, falling by a third of a percent as technical and momentum indicators weakened further on November 6. Given the breakdown below short-term moving averages, experts expect the index to decline further towards 25,450. A decisive break below this level could open the door for a fall to 25,350–25,300, which converges with the 50 percent Fibonacci retracement of the recent sharp rally and the 50-day EMA. However, on the higher side, resistance is placed in the 25,700–25,800 zone.
Here are 15 data points we have collated to help you spot profitable trades:
1) Key Levels For The Nifty 50 (25,510)
Resistance based on pivot points: 25,632, 25,676, and 25,748
Support based on pivot points: 25,489, 25,444, and 25,373
Special Formation: The Nifty 50 formed a bearish candle with an upper shadow on the daily timeframe, signaling selling pressure at higher levels and indicating a sell-on-rise opportunity. The index continued its lower high–lower low formation for the fifth consecutive session, falling below both the 20-day EMA and the midline of the Bollinger Bands. The RSI dropped to 49.76, while the MACD maintained its bearish crossover, with a further decline in its histogram. All these factors indicate persistent weakness in the short term and potential for further downside movement.
2) Key Levels For The Bank Nifty (57,554)
Resistance based on pivot points: 57,835, 57,936, and 58,098
Support based on pivot points: 57,511, 57,411, and 57,249
Resistance based on Fibonacci retracement: 58,735, 60,142
Support based on Fibonacci retracement: 57,394, 56,662
Special Formation: The Bank Nifty also formed a Nifty 50-like candle pattern on the daily charts and broke the consolidation range on the downside, signaling the possibility of increased selling pressure ahead. The index, however, still held above its 20-day EMA (which coincides with the 23.6 percent Fibonacci retracement of the recent sharp rally) and the midline of the Bollinger Bands. The RSI declined to 56.30 from Monday’s 65.60 level, while the MACD sustained its negative crossover, with the histogram falling further. All these indicators point toward potential short-term weakness and continued pressure on the index.
3) Nifty Call Options Data
According to the weekly options data, the maximum Call open interest was seen at the 26,000 strike (with 1.26 crore contracts). This level can act as a key resistance for the Nifty in the short term. It was followed by the 25,700 strike (1.07 crore contracts) and 25,800 strike (1.01 crore contracts).
Maximum Call writing was observed at the 25,600 strike, which saw an addition of 67.32 lakh contracts, followed by the 25,700 and 25,800 strikes, which added 62.24 lakh and 49.2 lakh contracts, respectively. The maximum Call unwinding was seen at the 25,200 strike, which shed 8,475 contracts, followed by the 25,000 and 25,100 strikes, which shed 2,625 and 2,400 contracts, respectively.
4) Nifty Put Options Data
On the Put side, the 25,000 strike holds the maximum Put open interest (with 86.15 lakh contracts), which can act as a key support level for the Nifty. It was followed by the 25,200 strike (75.73 lakh contracts) and the 25,500 strike (64.73 lakh contracts).
The maximum Put writing was placed at the 25,500 strike, which saw an addition of 34.8 lakh contracts, followed by the 25,400 and 25,000 strikes, which added 34.18 lakh and 25.62 lakh contracts, respectively. The maximum Put unwinding was seen at the 25,800 strike, which shed 4.48 lakh contracts, followed by the 26,000 and 26,100 strikes, which shed 2.07 lakh and 1.85 lakh contracts, respectively.
5) Bank Nifty Call Options Data
According to the monthly options data, the 58,000 strike holds the maximum Call open interest, with 15.88 lakh contracts. This can act as a key resistance level for the index in the short term. It was followed by the 58,500 strike (10.65 lakh contracts) and the 59,000 strike (8.84 lakh contracts).
Maximum Call writing was observed at the 58,000 strike (with the addition of 3.05 lakh contracts), followed by the 57,700 strike (1.12 lakh contracts) and 57,800 strike (1.03 lakh contracts). The maximum Call unwinding was seen at the 57,000 strike, which shed 1.29 lakh contracts, followed by the 59,000 and 59,700 strikes, which shed 31,990 and 4,235 contracts, respectively.
6) Bank Nifty Put Options Data
On the Put side, the maximum Put open interest was seen at the 58,000 strike (with 17.2 lakh contracts), which can act as a key level for the index. This was followed by the 57,000 strike (10.99 lakh contracts) and the 56,000 strike (7.35 lakh contracts).
The maximum Put writing was placed at the 57,600 strike (which added 1.15 lakh contracts), followed by the 57,700 strike (63,035 contracts) and the 57,500 strike (53,025 contracts). The maximum Put unwinding was seen at the 57,000 strike which shed 1.6 lakh contracts, followed by the 58,500 and 58,200 strikes, which shed 36,085 and 25,620 contracts, respectively.
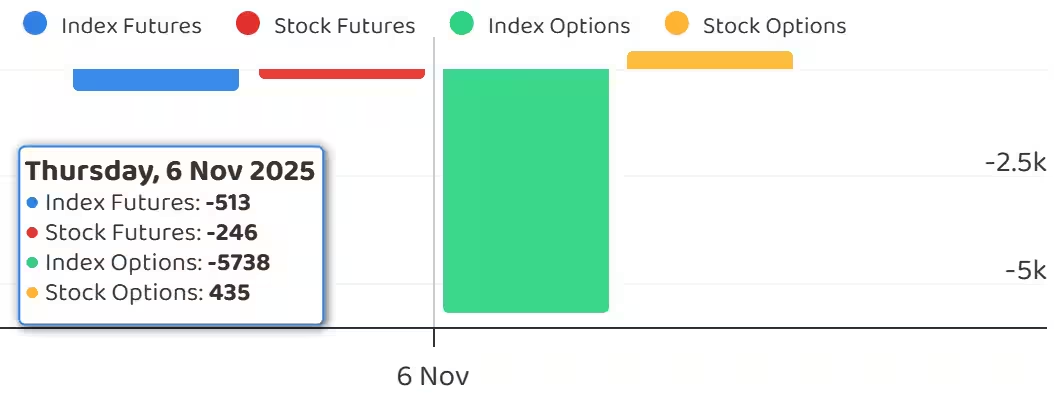
7) Funds Flow (Rs crore)
8) Put-Call Ratio
The Nifty Put-Call ratio (PCR), which indicates the mood of the market, fell to 0.77 on November 6, compared to 0.93 in the previous session.
The increasing PCR, or being higher than 0.7 or surpassing 1, means traders are selling more Put options than Call options, which generally indicates the firming up of a bullish sentiment in the market. If the ratio falls below 0.7 or moves towards 0.5, then it indicates selling in Calls is higher than selling in Puts, reflecting a bearish mood in the market.
9) India VIX
The India VIX, also known as the fear gauge, dropped 1.92 percent to 12.41 on Thursday, though it briefly moved near the 13 zone during intraday trade. The index continues to sustain above all key moving averages, except the 200 DEMA. Hence, experts advise caution for the bulls, noting that a fall and sustained move below the 12 zone could bring some comfort to bullish participants.
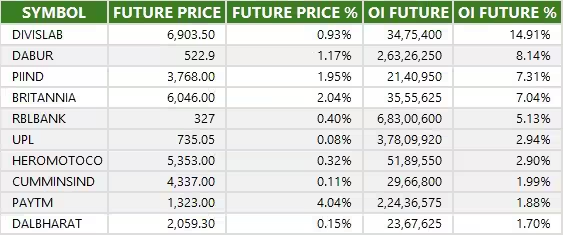
10) Long Build-up (18 Stocks)
A long build-up was seen in 18 stocks. An increase in open interest (OI) and price indicates a build-up of long positions.
11) Long Unwinding (69 Stocks)
69 stocks saw a decline in open interest (OI) along with a fall in price, indicating long unwinding.
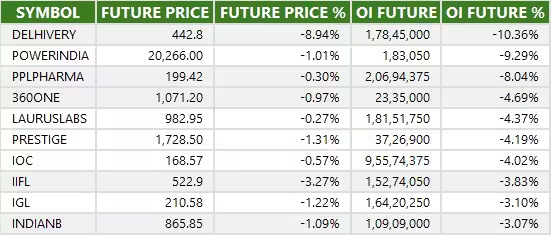
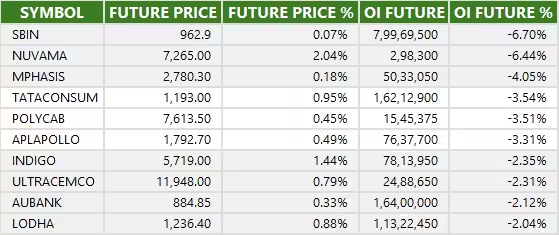
12) Short Build-up (101 Stocks)
101 stocks saw an increase in OI along with a fall in price, indicating a build-up of short positions.
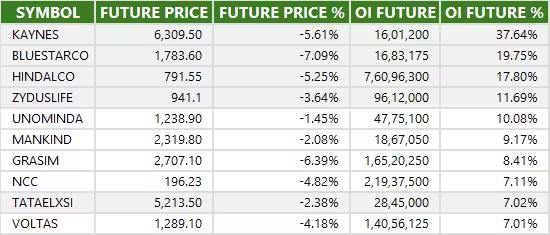
13) Short-Covering (26 Stocks)
26 stocks saw short-covering, meaning a decrease in OI, along with a price increase.
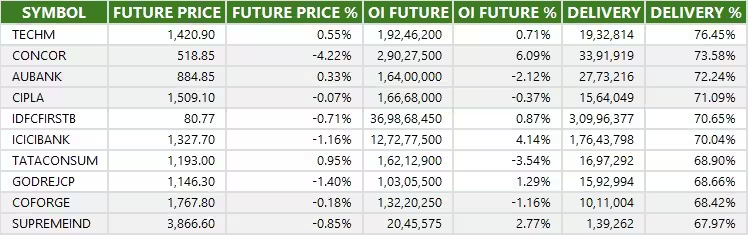
14) High Delivery Trades
Here are the stocks that saw a high share of delivery trades. A high share of delivery reflects investing (as opposed to trading) interest in a stock.
15) Stocks Under F&O Ban
Securities banned under the F&O segment include companies where derivative contracts cross 95 percent of the market-wide position limit.
Stocks added to F&O ban: Nil
Stocks retained in F&O ban: Nil
Stocks removed from F&O ban: Nil


0 Comment