28 Oct , 2025 By : Debdeep Gupta

The Nifty 50 rebounded sharply after a day of profit booking, climbing 171 points on October 27 ahead of the expiry of monthly F&O contracts due on October 28. Friday’s correction could not alter the broader uptrend as key moving averages continued to trend northward and momentum indicators remained healthy. The index reclaimed the 26,000 mark intraday but could not sustain above it. Experts said that if the index manages to stay above this level, then 26,100 is the level to watch, followed by the record high of 26,277, while immediate support is placed at 25,900, followed by 25,800 (around Monday’s low).
Here are 15 data points we have collated to help you spot profitable trades:
1) Key Levels For The Nifty 50 (25,966)
Resistance based on pivot points: 26,001, 26,044, and 26,112
Support based on pivot points: 25,865, 25,822, and 25,754
Special Formation: The Nifty 50 formed a bullish candle with a minor upper shadow on the daily charts, signalling a positive trend despite minor profit-taking at the 26,000 level. The index remained well above all crucial moving averages, which also sustained their northward trajectory. The RSI inched up to 71.49, while the MACD maintained its bullish bias, with the histogram staying above the zero line. All these indicators reflect continued strength in market momentum and support the bullish sentiment in the near term.
2) Key Levels For The Bank Nifty (58,114)
Resistance based on pivot points: 58,216, 58,351, and 58,569
Support based on pivot points: 57,779, 57,644, and 57,425
Resistance based on Fibonacci retracement: 58,739, 60,148
Support based on Fibonacci retracement: 57,383, 56,652
Special Formation: The Bank Nifty also formed a bullish candle with minor upper and lower shadows on the daily charts, indicating a positive trend despite some volatility. The index rose 415 points. The short- and medium-term averages trended upward. The RSI, at 72.11, which was earlier on the verge of a breakdown, maintained a bullish crossover, while the MACD sustained its positive bias with the histogram above the zero line. However, the Stochastic RSI showed a negative crossover, hinting at possible consolidation in the short term. All these indicators suggest underlying strength, though some near-term volatility cannot be ruled out.
3) Nifty Call Options Data
According to the monthly options data, the 26,500 strike holds the maximum Call open interest (with 1.72 crore contracts). This level can act as a key resistance for the Nifty in the short term. It was followed by the 26,100 strike (1.28 crore contracts), and the 26,000 strike (1.2 crore contracts).
Maximum Call writing was observed at the 26,550 strike, which saw an addition of 8.74 lakh contracts, followed by the 26,350 and 26,050 strikes, which added 3.73 lakh and 3.66 lakh contracts, respectively. The maximum Call unwinding was seen at the 25,900 strike, which shed 67.68 lakh contracts, followed by the 25,800 and 26,000 strikes, which shed 56.59 lakh and 57.96 lakh contracts, respectively.
4) Nifty Put Options Data
On the Put side, the maximum Put open interest was seen at the 25,900 strike (with 1.36 crore contracts), which can act as a key support level for the Nifty. It was followed by the 25,500 strike (1.32 crore contracts) and the 26,000 strike (1.22 crore contracts).
The maximum Put writing was placed at the 25,900 strike, which saw an addition of 98.98 lakh contracts, followed by the 26,000 and 25,950 strikes, which added 82.16 lakh and 53.47 lakh contracts, respectively. The maximum Put unwinding was seen at the 25,600 strike, which shed 8.7 lakh contracts, followed by the 26,500 and 26,200 strikes, which shed 2.76 lakh and 2.43 lakh contracts, respectively.
5) Bank Nifty Call Options Data
According to the monthly options data, the maximum Call open interest was seen at the 59,000 strike, with 14.79 lakh contracts. This can act as a key resistance level for the index in the short term. It was followed by the 58,500 strike (13.99 lakh contracts) and the 60,000 strike (13.22 lakh contracts).
Maximum Call writing was observed at the 58,200 strike (with the addition of 1.26 lakh contracts), followed by the 58,900 (1.08 lakh contracts) and 59,200 strike (93,590 contracts). The maximum Call unwinding was seen at the 59,500 strike, which shed 5.29 lakh contracts, followed by the 58,000 and 57,800 strikes, which shed 3.92 lakh and 2.98 lakh contracts, respectively.
6) Bank Nifty Put Options Data
On the Put side, the 58,000 strike holds the maximum Put open interest (with 19.01 lakh contracts), which can act as a key support level for the index. This was followed by the 57,000 strike (14.48 lakh contracts) and the 56,500 strike (11.88 lakh contracts).
The maximum Put writing was placed at the 58,000 strike (which added 11.53 lakh contracts), followed by the 58,100 strike (5.49 lakh contracts) and the 58,200 strike (4.94 lakh contracts). The maximum Put unwinding was seen at the 57,400 strike which shed 1.59 lakh contracts, followed by the 57,000 and 57,100 strikes, which shed 1.22 lakh and 94,115 contracts, respectively.
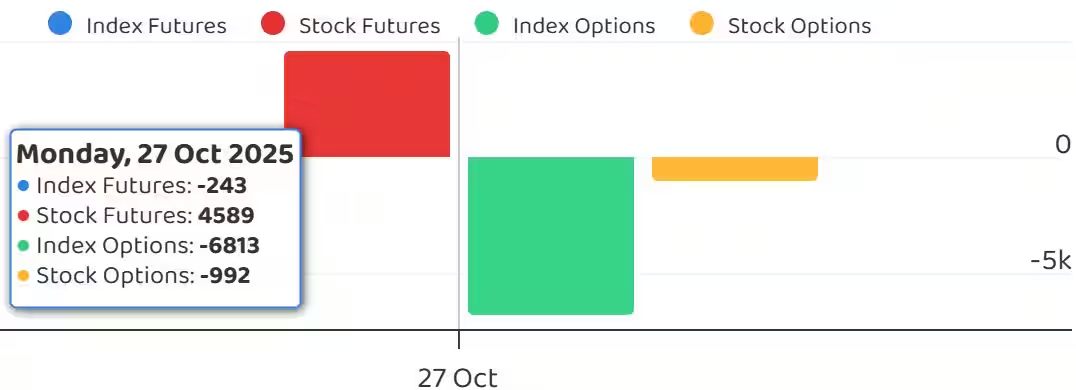
7) Funds Flow (Rs crore)
8) Put-Call Ratio
The Nifty Put-Call ratio (PCR), which indicates the mood of the market, climbed to 1.07 on October 27, compared to 0.76 in the previous session.
The increasing PCR, or being higher than 0.7 or surpassing 1, means traders are selling more Put options than Call options, which generally indicates the firming up of a bullish sentiment in the market. If the ratio falls below 0.7 or moves towards 0.5, then it indicates selling in Calls is higher than selling in Puts, reflecting a bearish mood in the market.
9) India VIX
The India VIX, which measures expected market volatility, climbed 2.31 percent to 11.86 after a day of decline. The volatility index has gradually been rising for the past couple of weeks, attempting to move toward 13 on Monday, but it could not sustain there and remained well below the 13–14 zone, which is considered supportive for the bulls.
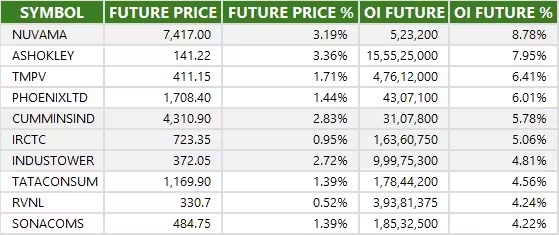
10) Long Build-up (82 Stocks)
A long build-up was seen in 82 stocks. An increase in open interest (OI) and price indicates a build-up of long positions.
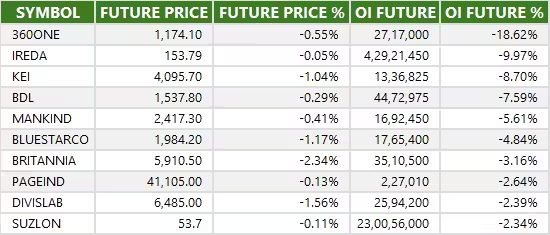
11) Long Unwinding (25 Stocks)
25 stocks saw a decline in open interest (OI) along with a fall in price, indicating long unwinding.
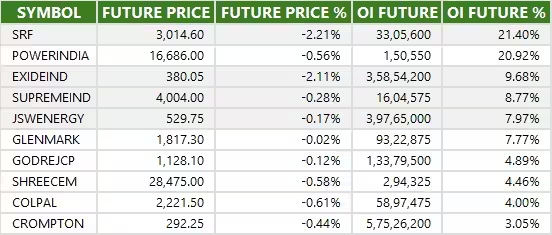
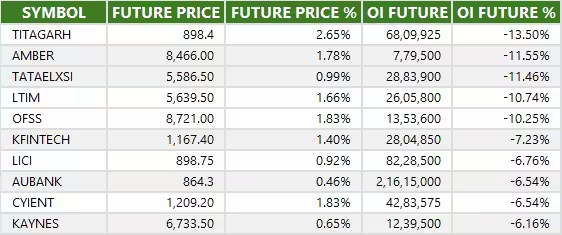
12) Short Build-up (33 Stocks)
33 stocks saw an increase in OI along with a fall in price, indicating a build-up of short positions.
13) Short-Covering (73 Stocks)
73 stocks saw short-covering, meaning a decrease in OI, along with a price increase.
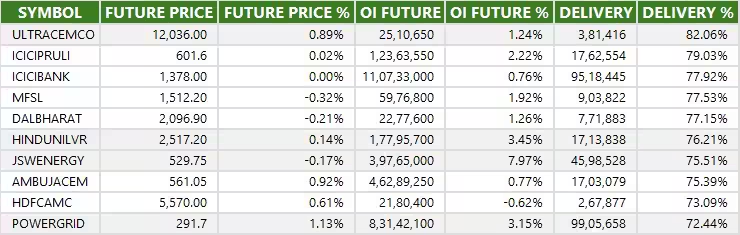
14) High Delivery Trades
Here are the stocks that saw a high share of delivery trades. A high share of delivery reflects investing (as opposed to trading) interest in a stock.
15) Stocks Under F&O Ban
Securities banned under the F&O segment include companies where derivative contracts cross 95 percent of the market-wide position limit.
Stocks added to F&O ban: Nil
Stocks retained in F&O ban: SAIL, Sammaan Capital
Stocks removed from F&O ban: Nil


0 Comment