25 May , 2025 By : Debdeep Gupta

The Nifty 50 rebounded on May 23, negating the lower highs of the previous five consecutive sessions. It rose by 1 percent to close at the key hurdle of 24,850, while climbing above the 10-day EMA. On the weekly timeframe, the index also traded well above all key moving averages, indicating that the overall trend remains positive. However, in the near term, the market may experience rangebound trading. If the index consistently defends the 24,700 level, a rally toward 25,000–25,200 cannot be ruled out. The crucial support is placed at 24,460, near the low of last week, according to experts.
Here are 15 data points we have collated to help you spot profitable trades:
1) Key Levels For The Nifty 50 (24,853)
Resistance based on pivot points: 24,905, 24,974, and 25,087
Support based on pivot points: 24,679, 24610, and 24,497
Special Formation: The Nifty 50 formed a long bullish candle on the daily charts, characterized by a higher high–higher low formation. The upper line of the Bollinger Bands remained in expansion mode, with resistance seen at 25,161. With the index surpassing the 10-day EMA, it traded well above all key moving averages. The MACD stayed well above the zero line, although it showed a negative crossover with moderate weakness in the histogram. The RSI was near 60, specifically at 59.33.
2) Key Levels For The Bank Nifty (55,398)
Resistance based on pivot points: 55,455, 55,594, and 55,818
Support based on pivot points: 55,007, 54,869, and 54,645
Resistance based on Fibonacci retracement: 56,307, 58,648
Support based on Fibonacci retracement: 54,117, 52,892
Special Formation: The Bank Nifty also reported a bullish candle on the daily timeframe, despite recording the lowest volume since January 1. It negated the lower highs–lower lows of the previous three straight sessions and traded above all key moving averages. The RSI, at approximately 59.74, showed a positive crossover, while the MACD remained well above the zero line despite a negative crossover.
3) Nifty Call Options Data
According to the monthly options data, the maximum Call open interest was seen at the 25,000 strike (with 77.26 lakh contracts). This level can act as a key resistance for the Nifty in the short term. It was followed by the 25,500 strike (70.77 lakh contracts), and the 25,800 strike (55.55 lakh contracts).
Maximum Call writing was observed at the 25,800 strike, which saw an addition of 25.36 lakh contracts, followed by the 24,900 and 25,700 strikes, which added 21.35 lakh and 17.74 lakh contracts, respectively. The maximum Call unwinding was seen at the 24,600 strike, which shed 20.46 lakh contracts, followed by the 25,000 and 24,700 strikes, which shed 9.68 lakh and 9.33 lakh contracts, respectively.
4) Nifty Put Options Data
On the Put side, the 24,000 strike holds the maximum Put open interest (with 97.55 lakh contracts), which can act as a key support level for the Nifty. It was followed by the 24,500 strike (91.83 lakh contracts) and the 24,800 strike (56.36 lakh contracts).
The maximum Put writing was placed at the 24,800 strike, which saw an addition of 33.34 lakh contracts, followed by the 24,900 and 24,500 strikes, which added 26.96 lakh and 24.06 lakh contracts, respectively. The Put unwinding was seen at the 25,500 strike, which shed 47,175 contracts, followed by the 25,450 and 25,700 strikes which shed 2,025 and 1,650 contracts, respectively.
5) Bank Nifty Call Options Data
According to the monthly options data, the maximum Call open interest was seen at the 55,500 strike, with 13.11 lakh contracts. This can act as a key resistance level for the index in the short term. It was followed by the 56,000 strike (12.66 lakh contracts) and the 57,000 strike (10.81 lakh contracts).
Maximum Call writing was visible at the 56,500 strike (with the addition of 68,190 contracts), followed by the 56,700 strike (60,570 contracts), and the 55,600 strike (50,520 contracts). The maximum Call unwinding was seen at the 55,000 strike, which shed 2.82 lakh contracts, followed by the 56,000 and 54,800 strikes, which shed 2.72 lakh and 1.13 lakh contracts, respectively.
6) Bank Nifty Put Options Data
On the Put side, the 55,000 strike holds the maximum Put open interest (with 17.02 lakh contracts), which can act as a key support level for the index. This was followed by the 54,000 strike (14.28 lakh contracts) and the 53,500 strike (9.83 lakh contracts).
The maximum Put writing was observed at the 53,500 strike (which added 3.98 lakh contracts), followed by the 55,500 strike (2.9 lakh contracts) and the 55,000 strike (2.49 lakh contracts). The maximum Put unwinding was seen at the 57,000 strike, which shed 12,510 contracts, followed by the 54,800 and 56,100 strikes, which shed 8,970 and 5,040 contracts, respectively.
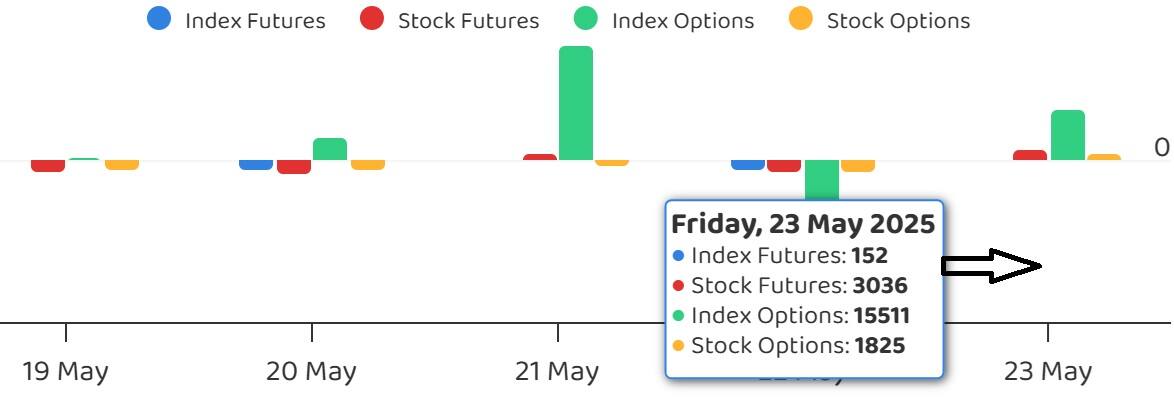
7) Funds Flow (Rs crore)
8) Put-Call Ratio
The Nifty Put-Call ratio (PCR), which indicates the mood of the market, jumped further to 1.09 on May 23, from 0.94 in the previous session.
The increasing PCR, or being higher than 0.7 or surpassing 1, means traders are selling more Put options than Call options, which generally indicates the firming up of a bullish sentiment in the market. If the ratio falls below 0.7 or moves towards 0.5, then it indicates selling in Calls is higher than selling in Puts, reflecting a bearish mood in the market.
9) India VIX
The India VIX, the fear index that measures expected market volatility, rose by 0.12 percent to 17.28 levels. Bulls need to remain cautious as long as the VIX stays above the 15 mark.
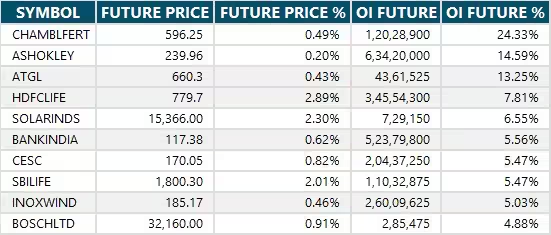
10) Long Build-up (95 Stocks)
A long build-up was seen in 95 stocks. An increase in open interest (OI) and price indicates a build-up of long positions.
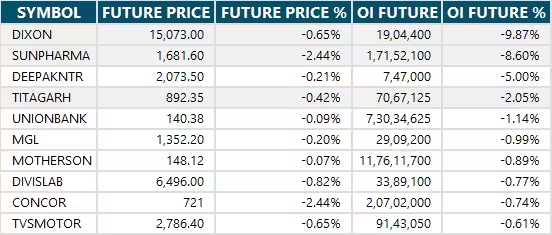
11) Long Unwinding (12 Stocks)
12 stocks saw a decline in open interest (OI) along with a fall in price, indicating long unwinding.
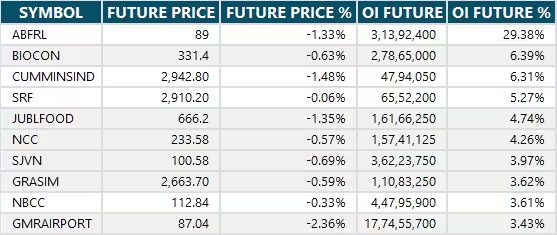
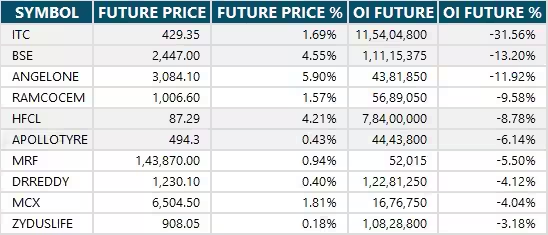
12) Short Build-up (37 Stocks)
37 stocks saw an increase in OI along with a fall in price, indicating a build-up of short positions.
13) Short-Covering (73 Stocks)
73 stocks saw short-covering, meaning a decrease in OI, along with a price increase.
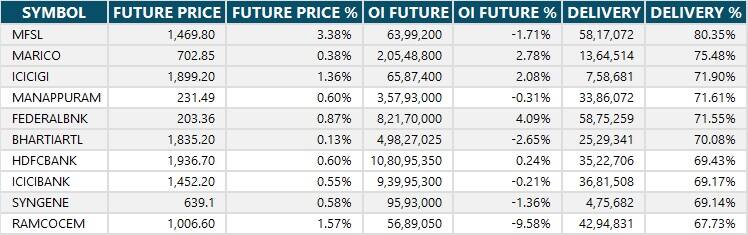
14) High Delivery Trades
Here are the stocks that saw a high share of delivery trades. A high delivery share reflects investing (as opposed to trading) interest in a stock.
15) Stocks Under F&O Ban
Securities banned under the F&O segment include companies where derivative contracts cross 95 percent of the market-wide position limit.
Stocks added to F&O ban: Chambal Fertilisers and Chemicals, Hindustan Copper
Stocks retained in F&O ban: Dixon Technologies, Manappuram Finance, RBL Bank, Titagarh Rail Systems
Stocks removed from F&O ban: Nil


0 Comment