21 Jul , 2025 By : Debdeep Gupta

The Nifty 50 fell six-tenths of a percent on July 18, extending its downtrend for the second consecutive session. The index tested the medium-term moving average (50-day EMA at 24,900) on the final trading day of the week, breaking below upward-sloping support trendlines amid weakness in momentum indicators. Hence, going forward, 24,900 is expected to be a crucial level to watch. If the index breaks and sustains below this level, a decline toward the 24,700 support is possible. However, if it holds above, the 25,000–25,100 zone will be key resistance levels, according to experts.
Here are 15 data points we have collated to help you spot profitable trades:
1) Key Levels For The Nifty 50 (24,968)
Resistance based on pivot points: 25,097, 25,150, and 25,236
Support based on pivot points: 24,924, 24,871, and 24,785
Special Formation: The Nifty 50 formed a bearish candle on the daily chart, continuing a lower highs–lower lows formation for another session. It traded near the lower line of the Bollinger Bands, accompanied by above-average volumes. The momentum indicator RSI dropped to 43.07, while the MACD histogram weakened further, signaling a bearish sentiment.
2) Key Levels For The Bank Nifty (56,283)
Resistance based on pivot points: 56,589, 56,707, and 56,898
Support based on pivot points: 56,207, 56,089, and 55,897
Resistance based on Fibonacci retracement: 57,047, 57,634
Support based on Fibonacci retracement: 56,098, 55,872
Special Formation: The Bank Nifty tested the lower line of the Bollinger Bands after a gap-down opening, falling decisively below its 20-day EMA and breaking down the upward-sloping support trendline. It formed a bearish candle with a sizeable upper shadow on the daily timeframe, indicating bearish bias. The MACD histogram continued to weaken, and the RSI declined to 45.30.
3) Nifty Call Options Data
According to the weekly options data, the maximum Call open interest was seen at the 25,200 strike (with 85.55 lakh contracts). This level can act as a key resistance for the Nifty in the short term. It was followed by the 25,100 strike (73.51 lakh contracts), and the 25,500 strike (67.89 lakh contracts).
Maximum Call writing was observed at the 25,100 strike, which saw an addition of 54.07 lakh contracts, followed by the 25,000 and 25,200 strikes, which added 43.25 lakh and 29.47 lakh contracts, respectively. There was hardly any Call unwinding seen in the 24,250-25,800 strike band.
4) Nifty Put Options Data
On the Put side, the 24,900 strike holds the maximum Put open interest (with 48.6 lakh contracts), which can act as a key support level for the Nifty. It was followed by the 25,000 strike (46.6 lakh contracts) and the 24,500 strike (41.56 lakh contracts).
The maximum Put writing was placed at the 24,900 strike, which saw an addition of 15.46 lakh contracts, followed by the 24,950 and 25,000 strikes, which added 15.35 lakh and 13.46 lakh contracts, respectively. The maximum Put unwinding was seen at the 25,200 strike, which shed 9.09 lakh contracts, followed by the 25,150 and 25,100 strikes, which shed 7.2 lakh and 6.49 lakh contracts, respectively.
5) Bank Nifty Call Options Data
According to the monthly options data, the 57,000 strike holds the maximum Call open interest, with 19.7 lakh contracts. This can act as a key resistance level for the index in the short term. It was followed by the 56,000 strike (14.19 lakh contracts) and the 57,500 strike (13.18 lakh contracts).
Maximum Call writing was visible at the 56,500 strike (with the addition of 5.39 lakh contracts), followed by the 57,000 strike (3.99 lakh contracts), and the 56,300 strike (1.68 lakh contracts). The maximum Call unwinding was seen at the 57,100 strike, which shed 24,815 contracts, followed by the 57,700 and 56,900 strikes, which shed 24,675 and 20,720 contracts, respectively.
6) Bank Nifty Put Options Data
On the Put side, the maximum Put open interest was seen at the 56,000 strike (with 22.62 lakh contracts), which can act as a key support level for the index. This was followed by the 57,000 strike (9.83 lakh contracts) and the 55,000 strike (9.08 lakh contracts).
The maximum Put writing was observed at the 56,500 strike (which added 1.4 lakh contracts), followed by the 56,400 strike (1.17 lakh contracts) and the 55,500 strike (1.13 lakh contracts). The maximum Put unwinding was seen at the 57,000 strike, which shed 2.01 lakh contracts, followed by the 56,000 and 56,800 strikes, which shed 94,885 and 93,730 contracts, respectively.
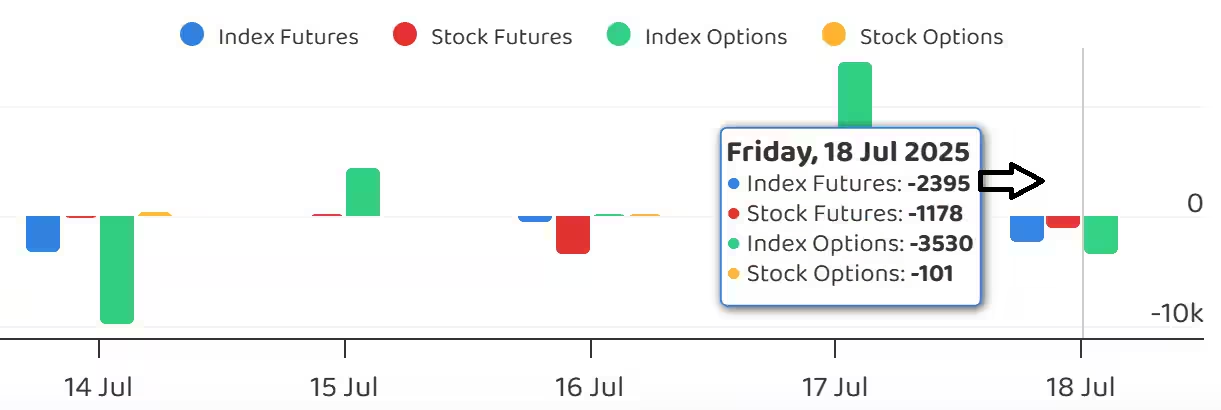
7) Funds Flow (Rs crore)
8) Put-Call Ratio
The Nifty Put-Call ratio (PCR), which indicates the mood of the market, declined to 0.78 on July 18, compared to 0.94 in the previous session.
The increasing PCR, or being higher than 0.7 or surpassing 1, means traders are selling more Put options than Call options, which generally indicates the firming up of a bullish sentiment in the market. If the ratio falls below 0.7 or moves towards 0.5, then it indicates selling in Calls is higher than selling in Puts, reflecting a bearish mood in the market.
9) India VIX
The India VIX, known as the fear gauge, gained for another session after moving in a wide range on Friday, rising 1.33 percent to 11.39 levels, though it remained in the lower zone. While this suggests market stability, it also serves as a signal to be alert for a potential major breakout or breakdown.
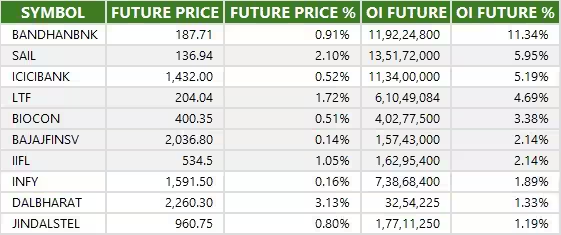
10) Long Build-up (17 Stocks)
A long build-up was seen in 17 stocks. An increase in open interest (OI) and price indicates a build-up of long positions.
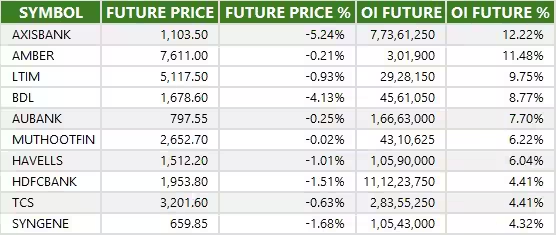
11) Long Unwinding (88 Stocks)
88 stocks saw a decline in open interest (OI) along with a fall in price, indicating long unwinding.
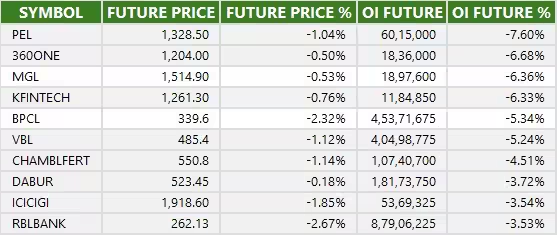
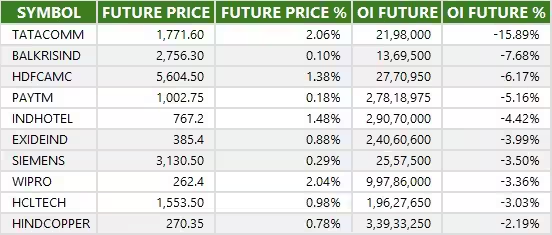
12) Short Build-up (91 Stocks)
91 stocks saw an increase in OI along with a fall in price, indicating a build-up of short positions.
13) Short-Covering (31 Stocks)
31 stocks saw short-covering, meaning a decrease in OI, along with a price increase.
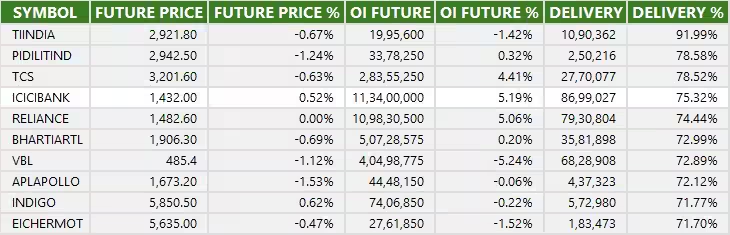
14) High Delivery Trades
Here are the stocks that saw a high share of delivery trades. A high share of delivery reflects investing (as opposed to trading) interest in a stock.
15) Stocks Under F&O Ban
Securities banned under the F&O segment include companies where derivative contracts cross 95 percent of the market-wide position limit.
Stocks added to F&O ban: Bandhan Bank
Stocks retained in F&O ban: Angel One, Hindustan Copper, RBL Bank
Stocks removed from F&O ban: Nil


0 Comment