18 Jul , 2025 By : Debdeep Gupta

The Nifty 50 snapped two-day gains and finished the weekly F&O expiry session with a 0.4 percent loss on July 17. Overall, the index still shows sideways action with a negative bias, considering the technical indicators, and may be waiting for a trigger to gain a firm direction. Until it shows a decisive close above the 20-day EMA (around 25,250), the consolidation may continue, with immediate support at 25,000 and then at 24,900 levels. Above 25,250, the immediate resistance is placed at 25,350 (the upper zone of the bearish gap of July 11), as sustaining above it can drive Nifty toward 25,550 and 25,700 levels, according to experts.
Here are 15 data points we have collated to help you spot profitable trades:
1) Key Levels For The Nifty 50 (25,111)
Resistance based on pivot points: 25,203, 25,235, and 25,288
Support based on pivot points: 25,098, 25,065, and 25,013
Special Formation: The Nifty 50 saw a bearish candle formation on the daily timeframe, negating the higher highs-higher lows formation of the previous two sessions. The index still sustained below short-term moving averages (10 and 20-day EMAs) and reached near the 50% Fibonacci retracement (June low-high - 25,070), which generally acts as support. The MACD maintained a bearish crossover with a weakening histogram, and the RSI dropped below 50 to 47.56 with a negative crossover. All these signals indicate consolidation with a negative bias.
2) Key Levels For The Bank Nifty (56,829)
Resistance based on pivot points: 57,142, 57,256, and 57,440
Support based on pivot points: 56,773, 56,659, and 56,474
Resistance based on Fibonacci retracement: 57,050, 57,566
Support based on Fibonacci retracement: 56,681, 56,389
Special Formation: The Bank Nifty formed a long bearish candle on the daily charts and failed to close above the falling resistance trendline, declining by 340 points. The index closed below the 10-day EMA but continued to defend the 20-day EMA (56,800) as well as the upward sloping support trendline. The MACD maintained a negative crossover with a weakening histogram, and the RSI at 52.99 failed to show a positive crossover, sustaining in the bearish crossover. All of this indicates further consolidation with a negative bias.
3) Nifty Call Options Data
According to the weekly options data, the 25,200 strike holds the maximum Call open interest (with 56.08 lakh contracts). This level can act as a key resistance for the Nifty in the short term. It was followed by the 25,500 strike (55.69 lakh contracts), and the 25,300 strike (34.44 lakh contracts).
Maximum Call writing was observed at the 25,200 strike, which saw an addition of 32.05 lakh contracts, followed by the 25,500 and 25,300 strikes, which added 27.61 lakh and 19.07 lakh contracts, respectively. The maximum Call unwinding was seen at the 24,800 strike, which shed 26,550 contracts.
4) Nifty Put Options Data
On the Put side, the maximum Put open interest was seen at the 25,200 strike (with 34.22 lakh contracts), which can act as a key level for the Nifty. It was followed by the 25,000 strike (33.14 lakh contracts) and the 24,900 strike (33.13 lakh contracts).
The maximum Put writing was placed at the 24,900 strike, which saw an addition of 18.61 lakh contracts, followed by the 25,100 and 24,500 strikes, which added 14.88 lakh and 13.64 lakh contracts, respectively. The maximum Put unwinding was seen at the 25,050 strike, which shed 51,075 contracts.
5) Bank Nifty Call Options Data
According to the monthly options data, the maximum Call open interest was observed at the 57,000 strike, with 15.71 lakh contracts. This can act as a key resistance level for the index in the short term. It was followed by the 56,000 strike (13.62 lakh contracts) and the 57,500 strike (11.59 lakh contracts).
Maximum Call writing was visible at the 57,000 strike (with the addition of 3.6 lakh contracts), followed by the 57,200 strike (1.54 lakh contracts), and the 57,500 strike (1.53 lakh contracts). The maximum Call unwinding was seen at the 56,400 strike, which shed 38,325 contracts, followed by the 58,100 and 56,100 strikes, which shed 21,455 and 15,400 contracts, respectively.
6) Bank Nifty Put Options Data
On the Put side, the 56,000 strike holds the maximum Put open interest (with 23.57 lakh contracts), which can act as a key support level for the index. This was followed by the 57,000 strike (11.85 lakh contracts) and the 55,000 strike (8.46 lakh contracts).
The maximum Put writing was observed at the 56,000 strike (which added 42,770 contracts), followed by the 55,900 strike (41,405 contracts) and the 55,000 strike (37,695 contracts). The maximum Put unwinding was seen at the 57,200 strike, which shed 94,850 contracts, followed by the 57,000 and 56,800 strikes, which shed 69,825 and 54,425 contracts, respectively.
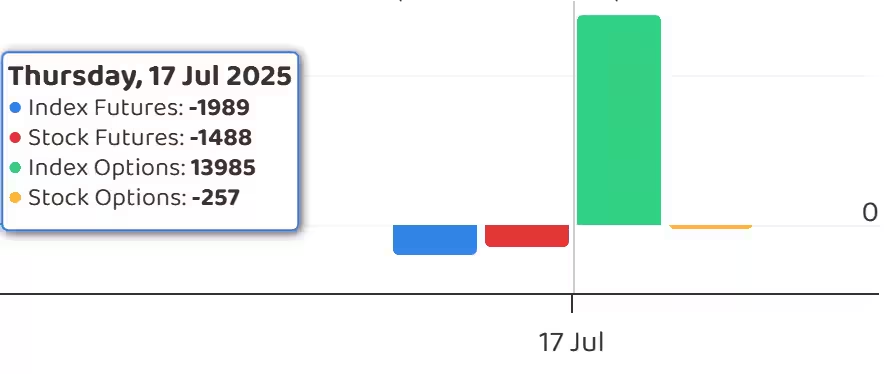
7) Funds Flow (Rs crore)
8) Put-Call Ratio
The Nifty Put-Call ratio (PCR), which indicates the mood of the market, advanced to 0.94 on July 17, compared to 0.92 in the previous session.
The increasing PCR, or being higher than 0.7 or surpassing 1, means traders are selling more Put options than Call options, which generally indicates the firming up of a bullish sentiment in the market. If the ratio falls below 0.7 or moves towards 0.5, then it indicates selling in Calls is higher than selling in Puts, reflecting a bearish mood in the market.
9) India VIX
The India VIX, which measures expected market volatility, sustained below the 12 mark, rising by 0.02 percent to 11.24 after falling in the previous two sessions. This generally shows stability in the market and low volatility, but participants need to be alert for any sharp breakout or breakdown in the market.
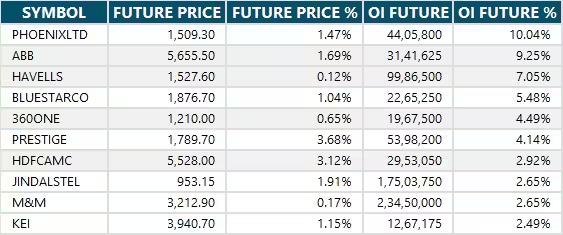
10) Long Build-up (40 Stocks)
A long build-up was seen in 40 stocks. An increase in open interest (OI) and price indicates a build-up of long positions.
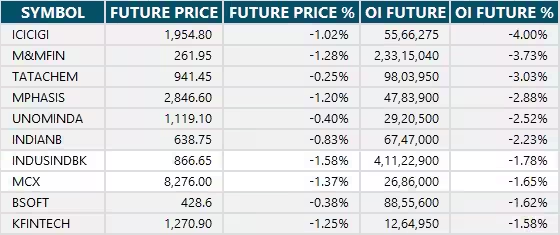
11) Long Unwinding (51 Stocks)
51 stocks saw a decline in open interest (OI) along with a fall in price, indicating long unwinding.
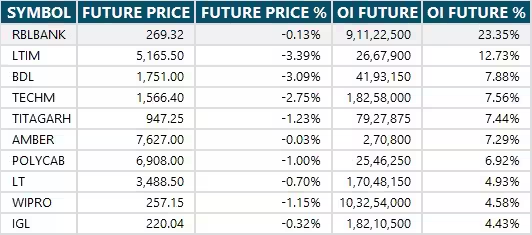
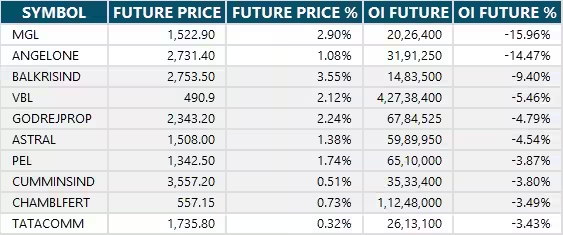
12) Short Build-up (71 Stocks)
71 stocks saw an increase in OI along with a fall in price, indicating a build-up of short positions.
13) Short-Covering (67 Stocks)
67 stocks saw short-covering, meaning a decrease in OI, along with a price increase.
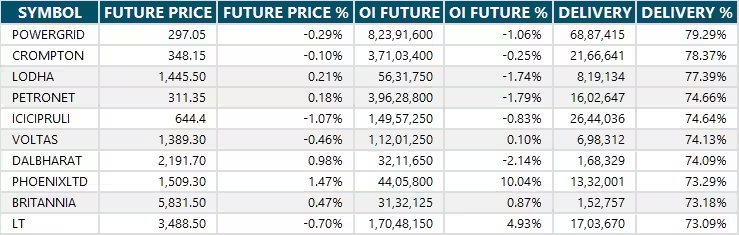
14) High Delivery Trades
Here are the stocks that saw a high share of delivery trades. A high share of delivery reflects investing (as opposed to trading) interest in a stock.
15) Stocks Under F&O Ban
Securities banned under the F&O segment include companies where derivative contracts cross 95 percent of the market-wide position limit.
Stocks added to F&O ban: RBL Bank
Stocks retained in F&O ban: Angel One, Hindustan Copper
Stocks removed from F&O ban: Nil


0 Comment