17 Jul , 2025 By : Debdeep Gupta

The Nifty 50 extended its uptrend, albeit with moderate gains, on July 16, closing 16 points higher with market breadth favouring the bulls. The index, after defending the 50% Fibonacci retracement level (from the June low to high), attempted twice to close above the 38.2% retracement level (25,214) and the 20-day EMA (25,250). As long as the index remains below these levels, consolidation may continue, with 25,100–25,000 acting as the support zone. However, if it manages to close strongly above these levels, 25,400 becomes the immediate resistance (23.6% retracement), followed by 25,550, according to experts.
Here are 15 data points we have collated to help you spot profitable trades:
1) Key Levels For The Nifty 50 (25,212)
Resistance based on pivot points: 25,247, 25,279, and 25,330
Support based on pivot points: 25,145, 25,113, and 25,062
Special Formation: The Nifty 50 formed a small green candle with a minor upper shadow and a long lower shadow, resembling a Doji-like pattern on the daily timeframe—indicating indecision among bulls and bears. The index continued to trade below its short-term moving averages (10-day and 20-day EMA) and the midline of the Bollinger Bands, which are key resistance zones. The momentum indicator RSI, at 51.05, maintained sideways action, while the Stochastic RSI gave a positive crossover in the oversold zone. Additionally, there was some improvement in the MACD histogram. These technical indicators suggest a potential shift in momentum, but confirmation through a strong directional move is awaited.
2) Key Levels For The Bank Nifty (57,169)
Resistance based on pivot points: 57,257, 57,337, and 57,467
Support based on pivot points: 56,998, 56,918, and 56,789
Resistance based on Fibonacci retracement: 57,581, 58,250
Support based on Fibonacci retracement: 57,034, 56,670
Special Formation: The Bank Nifty formed a High Wave-like pattern on the daily charts after rising for three consecutive sessions and closed near the downward-sloping resistance trendline. A decisive move above this trendline is crucial for further upside. The index sustained above both short- and medium-term moving averages, and the volume was above average. The RSI, at 58.76, appears to be inching upward and is on the verge of a positive crossover, while the Stochastic RSI showed a positive crossover. There was also further improvement in the MACD histogram. These technical indicators suggest increasing bullish momentum, but a breakout above the resistance trendline is needed to confirm continued strength.
3) Nifty Call Options Data
According to the weekly options data, the maximum Call open interest was placed at the 25,500 strike (with 1.33 crore contracts). This level can act as a key resistance for the Nifty in the short term. It was followed by the 25,300 strike (1.04 crore contracts), and the 25,200 strike (93.8 lakh contracts).
Maximum Call writing was observed at the 25,800 strike, which saw an addition of 31.19 lakh contracts, followed by the 25,250 and 25,550 strikes, which added 28.56 lakh and 18.56 lakh contracts, respectively. The maximum Call unwinding was seen at the 26,000 strike, which shed 35.75 lakh contracts, followed by the 25,900 and 26,050 strikes, which shed 7.36 lakh and 6.21 lakh contracts, respectively.
4) Nifty Put Options Data
On the Put side, the 25,000 strike holds the maximum Put open interest (with 1.17 crore contracts), which can act as a key support level for the Nifty. It was followed by the 25,200 strike (1.12 crore contracts) and the 25,100 strike (1.02 crore contracts).
The maximum Put writing was placed at the 25,150 strike, which saw an addition of 34.49 lakh contracts, followed by the 25,200 and 25,100 strikes, which added 22.25 lakh and 17.31 lakh contracts, respectively. The maximum Put unwinding was seen at the 24,400 strike, which shed 5 lakh contracts, followed by the 25,500 and 25,400 strikes, which shed 3.3 lakh and 2.71 lakh contracts, respectively.
5) Bank Nifty Call Options Data
According to the monthly options data, the 56,000 strike maintained maximum Call open interest, with 13.7 lakh contracts. This can act as a key level for the index in the short term. It was followed by the 57,000 strike (12.11 lakh contracts) and the 58,000 strike (10.37 lakh contracts).
Maximum Call writing was visible at the 59,000 strike (with the addition of 66,220 contracts), followed by the 57,200 strike (64,820 contracts), and the 58,000 strike (61,110 contracts). The maximum Call unwinding was seen at the 56,900 strike, which shed 52,395 contracts, followed by the 57,000 and 56,500 strikes, which shed 23,310 and 18,585 contracts, respectively.
6) Bank Nifty Put Options Data
On the Put side, the maximum Put open interest was seen at 56,000 strike (with 23.14 lakh contracts), which can act as a key support level for the index. This was followed by the 57,000 strike (12.55 lakh contracts) and the 56,500 strike (7.53 lakh contracts).
The maximum Put writing was observed at the 57,200 strike (which added 97,125 contracts), followed by the 57,000 strike (93,205 contracts) and the 56,000 strike (78,155 contracts). The maximum Put unwinding was seen at the 56,500 strike, which shed 25,340 contracts, followed by the 56,400 and 56,900 strikes, which shed 16,380 and 14,350 contracts, respectively.
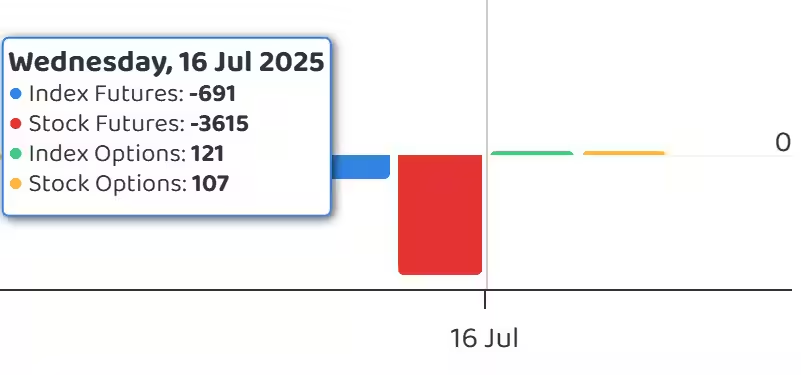
7) Funds Flow (Rs crore)
8) Put-Call Ratio
The Nifty Put-Call ratio (PCR), which indicates the mood of the market, rose to 0.92 on July 16, compared to 0.88 in the previous session.
The increasing PCR, or being higher than 0.7 or surpassing 1, means traders are selling more Put options than Call options, which generally indicates the firming up of a bullish sentiment in the market. If the ratio falls below 0.7 or moves towards 0.5, then it indicates selling in Calls is higher than selling in Puts, reflecting a bearish mood in the market.
9) India VIX
The India VIX, the fear index, continued its downward trend for another session and reached a fresh 15-month low, falling 2.09 percent to 11.24—its lowest closing level since April 26, 2024. This strengthens market stability.
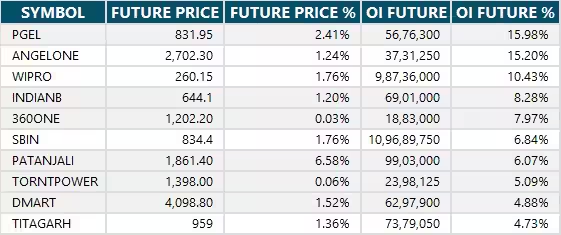
10) Long Build-up (53 Stocks)
A long build-up was seen in 53 stocks. An increase in open interest (OI) and price indicates a build-up of long positions.
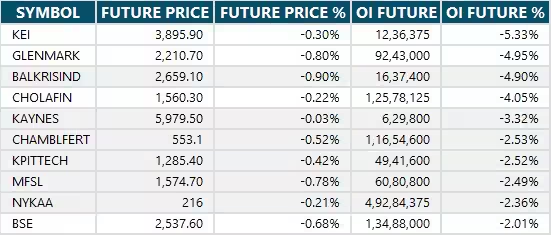
11) Long Unwinding (50 Stocks)
50 stocks saw a decline in open interest (OI) along with a fall in price, indicating long unwinding.
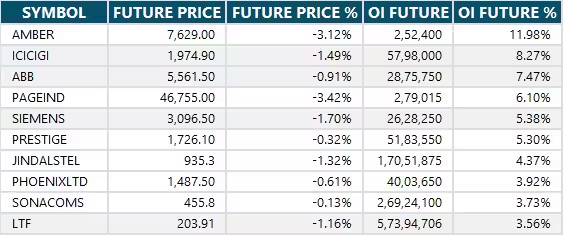
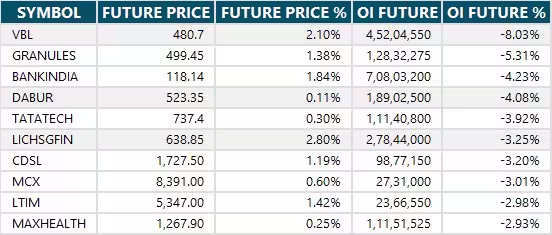
12) Short Build-up (71 Stocks)
71 stocks saw an increase in OI along with a fall in price, indicating a build-up of short positions.
13) Short-Covering (54 Stocks)
54 stocks saw short-covering, meaning a decrease in OI, along with a price increase.
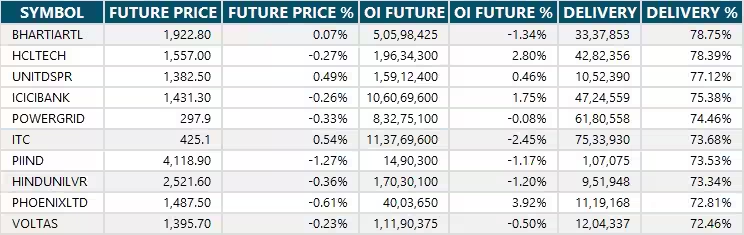
14) High Delivery Trades
Here are the stocks that saw a high share of delivery trades. A high share of delivery reflects investing (as opposed to trading) interest in a stock.
15) Stocks Under F&O Ban
Securities banned under the F&O segment include companies where derivative contracts cross 95 percent of the market-wide position limit.
Stocks added to F&O ban: Angel One
Stocks retained in F&O ban: Hindustan Copper
Stocks removed from F&O ban: Glenmark Pharma, RBL Bank


0 Comment