08 Aug , 2025 By : Debdeep Gupta

The Nifty 50 staged a healthy recovery in the last hour of trade on August 7, rebounding from a knee-jerk reaction to the Trump tariff announcement, and closed 22 points higher. The index managed to end the day just above the 100-day EMA (24,595) after recovering 250 points from the day’s low. However, it continued to trade below the 20-day and 50-day EMAs (24,850–24,900), signaling that bears remain active. According to experts, the index needs to sustain above the 100-day EMA to initiate an upward journey toward 24,900. Until then, consolidation and rangebound trading are expected to continue, with support placed at 24,350 (Thursday’s low).
Here are 15 data points we have collated to help you spot profitable trades:
1) Key Levels For The Nifty 50 (24,596)
Resistance based on pivot points: 24,636, 24,704, and 24,815
Support based on pivot points: 24,414, 24,346, and 24,235
Special Formation: The Nifty 50 formed a decent bullish candle with a long lower shadow on the daily charts, indicating market participants are willing to accumulate on dips. The index still maintained a lower highs–lower lows formation. Additionally, the 20-day EMA has crossed below the 50-day EMA, a sign of short-term weakness. The RSI remains at 39, sustaining its bearish crossover. The MACD is well below the zero line, although weakness in the histogram has faded further. All these technical indicators suggest that the broader trend remains cautious.
2) Key Levels For The Bank Nifty (55,521)
Resistance based on pivot points: 55,615, 55,766, and 56,011
Support based on pivot points: 55,125, 54,974, and 54,729
Resistance based on Fibonacci retracement: 55,988, 56,301
Support based on Fibonacci retracement: 55,066, 54,370
Special Formation: The Bank Nifty also formed a bullish candle with a lower wick, pointing to buying interest at lower levels, but the index continued its lower tops–lower bottoms formation. While it sustained above the 100-day EMA, it still traded well below the short-term moving averages (20-day and 50-day EMAs) and also below the midline of the Bollinger Bands. Additionally, the MACD remains below the zero line, though the momentum weakness has reduced. The RSI stands at 38.76, maintaining a bearish crossover. These indicators collectively suggest that the overall structure remains weak, and further confirmation is needed for a bullish reversal.
3) Nifty Call Options Data
According to the weekly options data, the maximum Call open interest was seen at the 25,000 strike (with 53.4 lakh contracts). This level can act as a key resistance for the Nifty in the short term. It was followed by the 25,500 strike (43.84 lakh contracts), and the 24,200 strike (34.26 lakh contracts).
Maximum Call writing was observed at the 25,000 strike, which saw an addition of 28.82 lakh contracts, followed by the 25,500 and 24,500 strikes, which added 21.11 lakh and 18.71 lakh contracts, respectively. There was hardly any Call unwinding seen in the 23,900-25,500 strike band.
4) Nifty Put Options Data
On the Put side, the 24,500 strike holds the maximum Put open interest (with 46.26 lakh contracts), which can act as a key support level for the Nifty. It was followed by the 24,000 strike (46.18 lakh contracts) and the 24,400 strike (35.88 lakh contracts).
The maximum Put writing was placed at the 24,500 strike, which saw an addition of 30.01 lakh contracts, followed by the 24,400 and 24,200 strikes, which added 24.32 lakh and 21.95 lakh contracts, respectively. There was hardly any Put unwinding seen in the 23,850-25,550 strike band.
5) Bank Nifty Call Options Data
According to the monthly options data, the 57,000 strike holds the maximum Call open interest, with 21.94 lakh contracts. This can act as a key resistance level for the index in the short term. It was followed by the 56,000 strike (12.47 lakh contracts) and the 55,500 strike (7.24 lakh contracts).
Maximum Call writing was observed at the 55,000 strike (with the addition of 49,770 contracts), followed by the 56,000 strike (33,810 contracts), and the 55,200 strike (30,205 contracts). The maximum Call unwinding was seen at the 57,000 strike, which shed 35,840 contracts, followed by the 55,500 and 55,400 strikes, which shed 34,755 and 22,260 contracts, respectively.
6) Bank Nifty Put Options Data
On the Put side, the maximum Put open interest was seen at the 57,000 strike (with 13.52 lakh contracts), which can act as a key level for the index. This was followed by the 54,000 strike (9.33 lakh contracts) and the 55,000 strike (9.18 lakh contracts).
The maximum Put writing was observed at the 55,100 strike (which added 61,425 contracts), followed by the 55,200 strike (25,830 contracts) and the 54,000 strike (24,815 contracts). The maximum Put unwinding was seen at the 56,000 strike, which shed 64,820 contracts, followed by the 57,000 and 55,400 strikes, which shed 32,515 and 26,915 contracts, respectively.
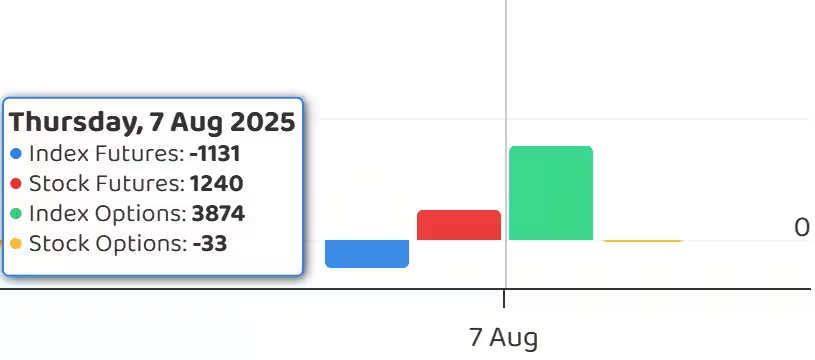
7) Funds Flow (Rs crore)
8) Put-Call Ratio
The Nifty Put-Call ratio (PCR), which indicates the mood of the market, jumped to 1.06 on August 7, compared to 0.74 in the previous session.
The increasing PCR, or being higher than 0.7 or surpassing 1, means traders are selling more Put options than Call options, which generally indicates the firming up of a bullish sentiment in the market. If the ratio falls below 0.7 or moves towards 0.5, then it indicates selling in Calls is higher than selling in Puts, reflecting a bearish mood in the market.
9) India VIX
The India VIX, the market’s fear gauge, spiked above the 12 zone during the session, but ultimately finished 2.28 percent lower at 11.69, offering some comfort to the bulls. The index has been hovering around its short-term moving averages for the past couple of weeks.
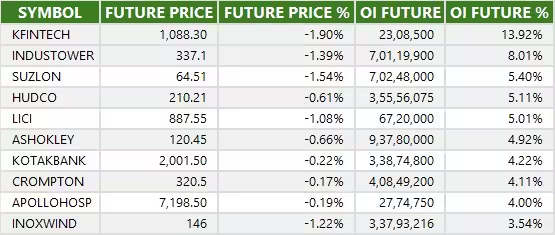
10) Long Build-up (71 Stocks)
A long build-up was seen in 71 stocks. An increase in open interest (OI) and price indicates a build-up of long positions.

11) Long Unwinding (28 Stocks)
28 stocks saw a decline in open interest (OI) along with a fall in price, indicating long unwinding.
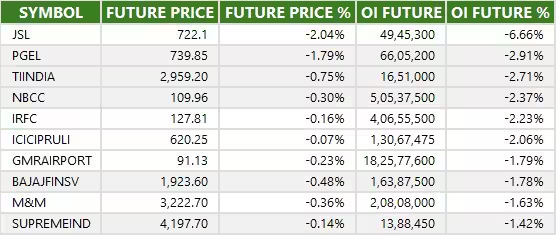
12) Short Build-up (43 Stocks)
43 stocks saw an increase in OI along with a fall in price, indicating a build-up of short positions.
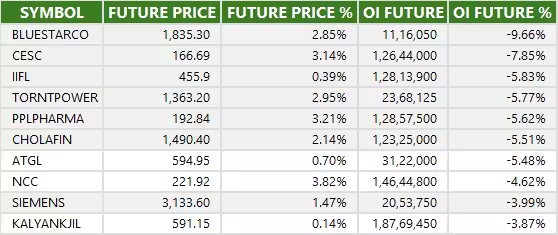
13) Short-Covering (78 Stocks)
78 stocks saw short-covering, meaning a decrease in OI, along with a price increase.
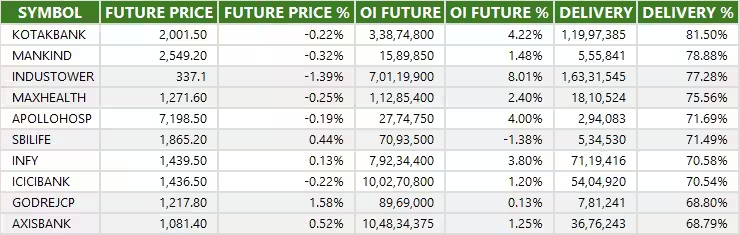
14) High Delivery Trades
Here are the stocks that saw a high share of delivery trades. A high share of delivery reflects investing (as opposed to trading) interest in a stock.
15) Stocks Under F&O Ban
Securities banned under the F&O segment include companies where derivative contracts cross 95 percent of the market-wide position limit.
Stocks added to F&O ban: Nil
Stocks retained in F&O ban: PNB Housing Finance
Stocks removed from F&O ban: Nil


0 Comment