06 Aug , 2025 By : Debdeep Gupta

The benchmark Nifty 50 saw some selling pressure on August 5 after a day of rally, falling 73 points amid caution ahead of the RBI monetary policy meeting outcome due on August 6. The lower highs-lower lows formation remains intact, along with bearish momentum indicators, and the index continued to trade below both short- and medium-term moving averages. Hence, if the index decisively breaks the 24,500 zone, which coincides with the previous week's low as well as the June low, the selling pressure may extend further. However, on the higher side, the 24,800–24,900 levels are crucial to watch, according to experts.
Here are 15 data points we have collated to help you spot profitable trades:
1) Key Levels For The Nifty 50 (24,650)
Resistance based on pivot points: 24,712, 24,746, and 24,800
Support based on pivot points: 24,603, 24,569, and 24,515
Special Formation: The Nifty 50 formed a bearish candle with a lower shadow on the daily charts, indicating an erosion of some of the previous day's gains. The index defended the 100-day EMA for another session but still traded below the 20-day and 50-day EMAs, continuing its lower highs-lower lows structure. The MACD remained below the zero line, though the weakness in the histogram faded for another session. The RSI stood at 40.01, while the Stochastic RSI maintained a bearish crossover. All these factors indicate continued weakness.
2) Key Levels For The Bank Nifty (55,360)
Resistance based on pivot points: 55,574, 55,679, and 55,849
Support based on pivot points: 55,234, 55,129, and 54,959
Resistance based on Fibonacci retracement: 55,075, 54,379
Support based on Fibonacci retracement: 55,766, 56,122
Special Formation: The Bank Nifty also continued to trade below its 20-day and 50-day EMAs, though it held well above the 100-day EMA. The 10-day EMA crossed below the 50-day EMA, further confirming the bearish setup. The index formed a bearish candle with upper and lower shadows on the daily timeframe, continuing the lower tops-lower bottoms formation, which signals weakness. The MACD remained below the zero line with a bearish histogram, while the RSI dropped to 35.75, with a bearish crossover. All these indicators point toward persistent bearish sentiment.
3) Nifty Call Options Data
According to the weekly options data, the maximum Call open interest was seen at the 25,000 strike (with 1.33 crore contracts). This level can act as a key resistance for the Nifty in the short term. It was followed by the 24,800 strike (1.02 crore contracts), and the 24,700 strike (1.01 crore contracts).
Maximum Call writing was observed at the 24,600 strike, which saw an addition of 43.53 lakh contracts, followed by the 24,700 and 25,000 strikes, which added 40.35 lakh and 26.2 lakh contracts, respectively. The maximum Call unwinding was seen at the 25,500 strike, which shed 3.77 lakh contracts, followed by the 25,450 and 24,000 strikes, which shed 1.76 lakh and 41,250 contracts, respectively.
4) Nifty Put Options Data
On the Put side, the 24,000 strike holds the maximum Put open interest (with 91.95 lakh contracts), which can act as a key support level for the Nifty. It was followed by the 24,600 strike (88.92 lakh contracts) and the 24,500 strike (84.63 lakh contracts).
The maximum Put writing was placed at the 24,500 strike, which saw an addition of 11.99 lakh contracts, followed by the 24,600 and 24,000 strikes, which added 10.69 lakh and 10.05 lakh contracts, respectively. The maximum Put unwinding was seen at the 24,700 strike, which shed 19.11 lakh contracts, followed by the 24,800 and 24,750 strikes, which shed 11.89 lakh and 8.37 lakh contracts, respectively.
5) Bank Nifty Call Options Data
According to the monthly options data, the 57,000 strike holds the maximum Call open interest, with 21.59 lakh contracts. This can act as a key resistance level for the index in the short term. It was followed by the 56,000 strike (12.41 lakh contracts) and the 55,500 strike (7.44 lakh contracts).
Maximum Call writing was observed at the 55,500 strike (with the addition of 4.11 lakh contracts), followed by the 56,000 strike (2.63 lakh contracts), and the 57,500 strike (1.83 lakh contracts). The maximum Call unwinding was seen at the 56,400 strike, which shed 19,215 contracts, followed by the 57,300 and 57,400 strikes, which shed 8,505 and 1,540 contracts, respectively.
6) Bank Nifty Put Options Data
On the Put side, the maximum Put open interest was seen at the 57,000 strike (with 13.89 lakh contracts), which can act as a key level for the index. This was followed by the 56,000 strike (9.76 lakh contracts) and the 55,000 strike (8.9 lakh contracts).
The maximum Put writing was observed at the 55,300 strike (which added 83,020 contracts), followed by the 55,500 strike (70,525 contracts) and the 55,000 strike (46,200 contracts). The maximum Put unwinding was seen at the 55,600 strike, which shed 23,520 contracts, followed by the 56,500 and 55,900 strikes, which shed 16,170 and 15,750 contracts, respectively.
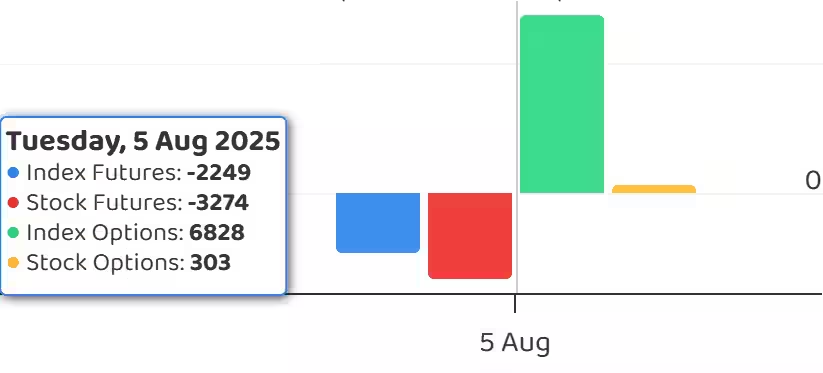
7) Funds Flow (Rs crore)
8) Put-Call Ratio
The Nifty Put-Call ratio (PCR), which indicates the mood of the market, declined to 0.83 on August 5, compared to 0.94 in the previous session.
The increasing PCR, or being higher than 0.7 or surpassing 1, means traders are selling more Put options than Call options, which generally indicates the firming up of a bullish sentiment in the market. If the ratio falls below 0.7 or moves towards 0.5, then it indicates selling in Calls is higher than selling in Puts, reflecting a bearish mood in the market.
9) India VIX
The India VIX, known as the fear gauge, corrected for another session, falling 2.13 percent to 11.71, offering some comfort to bulls. Overall, the VIX being in a lower zone provides stability and indicates the possibility of range-bound trading, though sudden sharp moves on either side can't be ruled out.
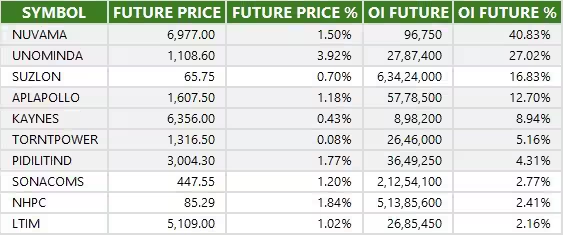
10) Long Build-up (33 Stocks)
A long build-up was seen in 33 stocks. An increase in open interest (OI) and price indicates a build-up of long positions.
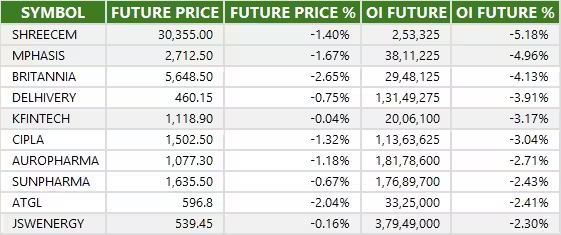
11) Long Unwinding (56 Stocks)
56 stocks saw a decline in open interest (OI) along with a fall in price, indicating long unwinding.
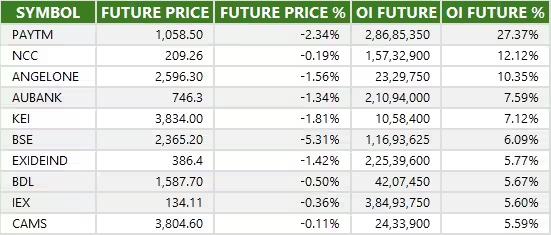
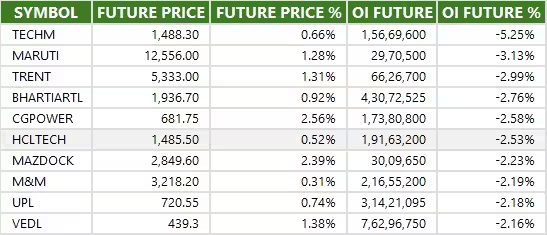
12) Short Build-up (93 Stocks)
93 stocks saw an increase in OI along with a fall in price, indicating a build-up of short positions.
13) Short-Covering (36 Stocks)
36 stocks saw short-covering, meaning a decrease in OI, along with a price increase.
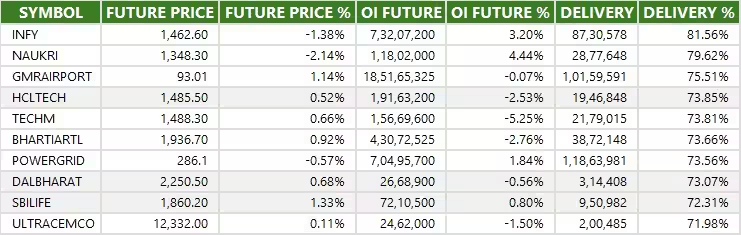
14) High Delivery Trades
Here are the stocks that saw a high share of delivery trades. A high share of delivery reflects investing (as opposed to trading) interest in a stock.
15) Stocks Under F&O Ban
Securities banned under the F&O segment include companies where derivative contracts cross 95 percent of the market-wide position limit.
Stocks added to F&O ban: Nil
Stocks retained in F&O ban: PNB Housing Finance
Stocks removed from F&O ban: Nil


0 Comment